
Graphing and Properties of x^2 - x Function
Loading the math board and drawing, please wait…
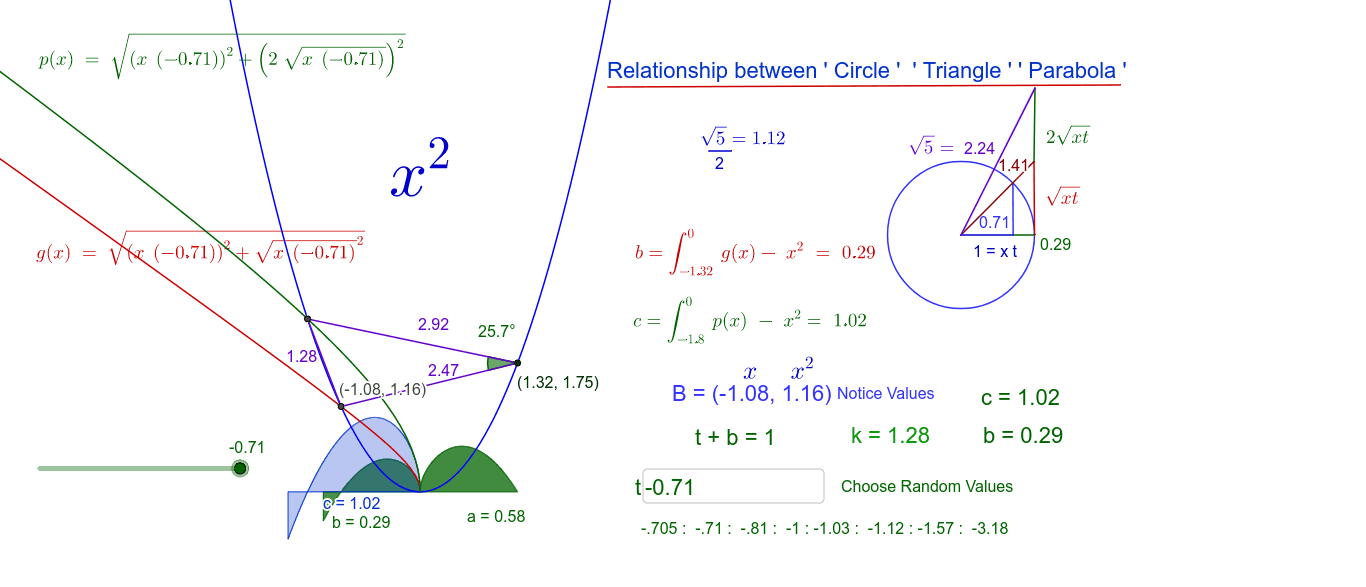
This example demonstrates the graph of the function x^2 - x and its key properties such as vertex, axis of symmetry, and zeros using GeoGebra. Core math concepts include quadratic functions, derivatives, integrals, symmetry, and function zeros. Construction highlights involve using commands like Intersect for intersection points, Integral for area calculation, Textfield for displaying information, Point for marking special points, Polygon and Segment for drawing shapes, Angle for measuring angles, and Circle for drawing circles. Suitable for high school mathematics teaching, focusing on function graph analysis and property exploration.
GeoGebra Commands & Parameters
Intersect(f, h, (1.3247179572097767, 1.7548776662103318)) → AIntegral(f(x) - h(x), 0, 1.32) → aIntersect(g, h, (-1.0782324076626095, 1.1625851241606506)) → BIntegral(g(x) - h(x), -1.32, 0) → bTextfield(t) → InputBox1Intersect(h, p, (-1.5345410449425416, 2.3548162186133474)) → CIntegral(p(x) - h(x), -1.8, 0) → cPoint(h) → DPoint(h) → EPoint(h) → FPoint(h) → GPolygon(B, D, E, F, G, C) → poly1, b_1, d, e, f_1, g_1, c_1Segment(B, A) → iSegment(A, C) → jSegment(C, B) → kAngle(C, A, B) → αPoint(Circle[H, 0.71]) → ISegment(H, I) → lPoint(Circle[I, 0.29]) → JSegment(I, J) → mPoint(Circle[I, 0.71]) → KSegment(I, K) → nCircle(H, 1) → qPoint(Circle[J, 1]) → LSegment(J, L) → rPoint(Circle[L, 1]) → MSegment(L, M) → sSegment(H, L) → h_1Segment(M, H) → i_1Segment(N, O) → j_1Point(Circle[P, 0.3]) → QSegment(P, Q) → k_1