
Graphing Absolute Value Functions
Loading the math board and drawing, please wait…
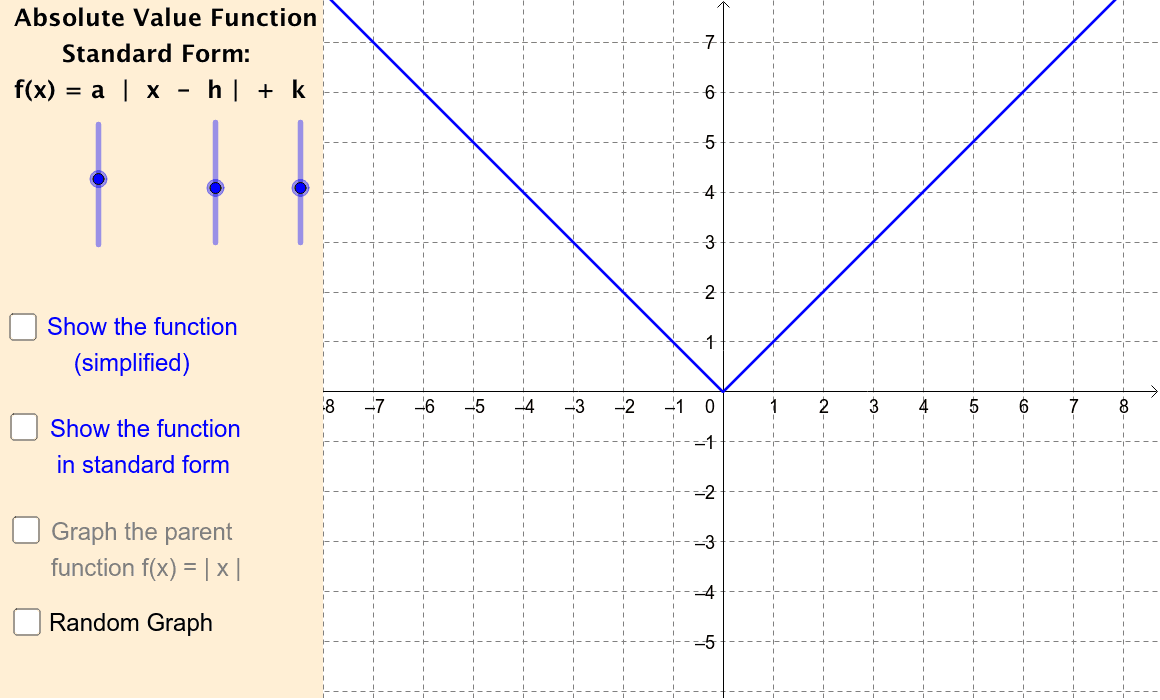
This example demonstrates how to graph absolute value functions of the form f(x) = a|x – h| + k by adjusting the integer values of parameters a, h, and k. Observe the transformations of the function graph and compare the standard and simplified forms. Key math concepts include function graph transformations, symmetry, slope, and vertex coordinates. GeoGebra commands and objects used: a, h, k, standardForm, parentFunction, xMin, g, b, c, e, rand, randValueA, randValueK, randValueH, d, i, graphedFuncStForm, graphedFuncStFormCkBoxLabel, graphedFuncSimplifiedCkBoxLabel, graphFuncSimplifiedAnotZero, graphFuncSimplifiedAisZero, f, pic1. Suitable for high school mathematics teaching and function graph learning.
GeoGebra Commands & Parameters
Numeric a(1.0)Numeric h(0.0)Numeric k(0.0)Numeric xMin(-8.0)g(x) = If[x > xMin,abs(x)]b(x) = x < xMinBoolean c(false)Boolean e(false)Boolean rand(false)Random[-5, 5] + rand - randRandom[-5, 6] + rand - randRandom[-5, 5] + rand - randd(x) = If[x > xMin,(randValueA * abs(x - randValueH)) + randValueK]Boolean i(false)f(x) = If[x > -8,(a * abs(x - h)) + k]
AI Drawing Prompt Reference
Draw the graph of the absolute value function f(x) = a|x - h| + k, where a, h, and k are integers. Adjust the values of a, h, and k to observe changes in the graph, including translations, stretches, and compressions. Set the minimum value of x to -8.
The prompt above was compiled from the original drawing commands and is for reference only.