
Data Analysis with Two Scatter Plots and Polynomial Regression
Loading the math board and drawing, please wait…
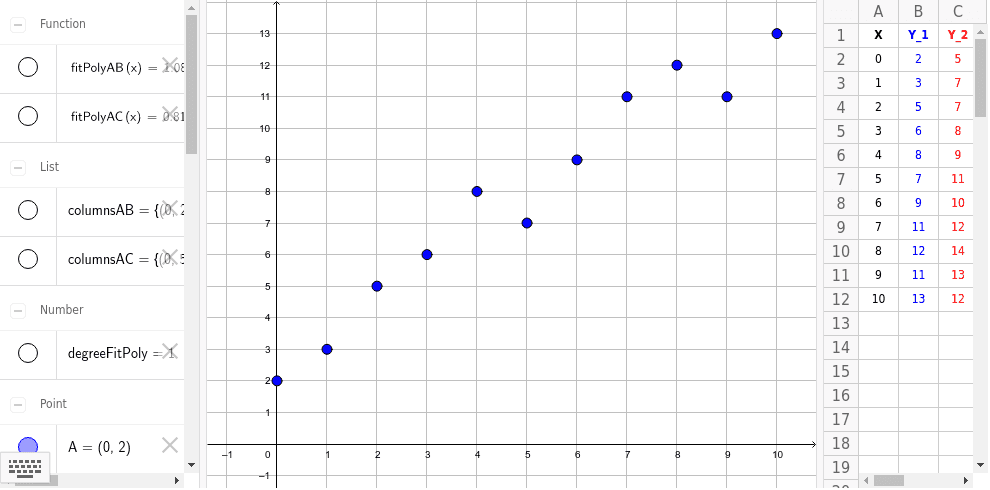
This example demonstrates data analysis using two scatter plots, where polynomial regression curves are fitted to the data points via the FitPoly command in GeoGebra. It visually shows how regression lines or curves approximate the underlying trend of scattered data. Core mathematical concepts include scatter plots, linear and polynomial regression, confidence intervals, and function approximation. The construction uses the FitPoly command on data points labeled A2 through A12 and B2 through B12, generating fitted polynomial functions. Additionally, geometric objects such as cubes and cuboids are included, possibly to illustrate data ranges or enhance visualization. This resource is suitable for high school and college-level statistics or data analysis courses, helping students grasp regression analysis and its practical applications in modeling real-world data.
GeoGebra Commands & Parameters
FitPoly(columnsAB, degreeFitPoly) → fitPolyABFitPoly(columnsAC, degreeFitPoly) → fitPolyAC