
Graphing Absolute Value Functions Transformations
Loading the math board and drawing, please wait…
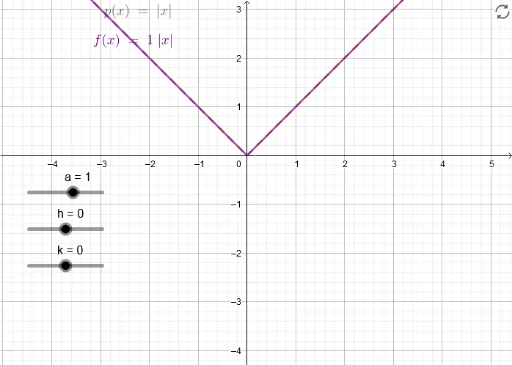
This example dynamically visualizes transformations of absolute value function graphs, including translations and dilations. Key math concepts involve absolute value functions, geometric transformations, and function graphing. GeoGebra commands used are: a (coefficient), h (horizontal translation), k (vertical translation), p (dilation scale), f (function expression). Suitable for high school mathematics teaching to understand function transformation rules and graph characteristics.
GeoGebra Commands & Parameters
Numeric a(1)Numeric h(0)Numeric k(0)p(x) = abs(x)f(x) = (a * abs(x - h)) + k
AI Drawing Prompt Reference
Draw the graph of an absolute value function, starting with y=|x|, then apply horizontal translation by h units, vertical translation by k units, and dilation by a scale factor p. Set h=0, k=0, p=1, and a=1, and adjust these parameters to observe the changes in the graph.
The prompt above was compiled from the original drawing commands and is for reference only.