
Graphing a Given Linear Equation (Self Practice)
Loading the math board and drawing, please wait…
In collections
Introduction to Linear Functions and Graphs
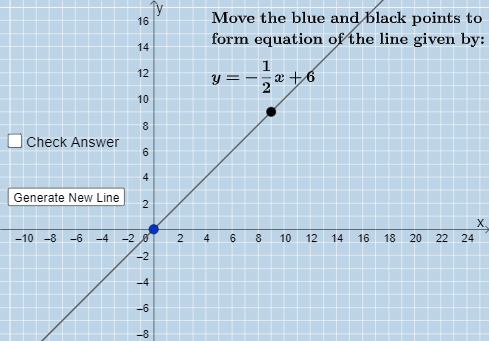
This example demonstrates how to graph linear equations using the slope-intercept method. Key math concepts include standard form of linear equations, slope-intercept form, and coordinate geometry. Construction highlights: utilizes GeoGebra commands like Sequence, Random, Union, Point, Line, If, FractionText, Denominator, Numerator; objects include a, e, c, b, d, m, k, f, B, A, g, button1, text1, text2, text4, button2, text5, h, button3, i, j, l, text3, text6. Suitable for middle school and above students to understand the graphical representation of linear equations and parameter variations.
GeoGebra Commands & Parameters
Sequence(i, i, -10, -1) → a, {-10, -9, -8, -7, -6, -5, -4, -3, -2, -1}Random(-12, 12) → eSequence(i, i, 1, 10) → c, {1, 2, 3, 4, 5, 6, 7, 8, 9, 10}Sequence(i, i, -10, -1) → b, {-10, -9, -8, -7, -6, -5, -4, -3, -2, -1}Union(b, c) → dPoint(x = 0) → ALine(A, B) → gIf(k > 0, If[m ≟ 1, "", "" + (FractionText[abs(Slope[f])])], If[k < 0, If[m ≟ -1, "-", "-" + (FractionText[abs(Slope[f])])]]) → text1FractionText(f(0)) → text2Denominator(m) → iNumerator(m) → j
AI Drawing Prompt Reference
Create a coordinate-plane graph illustrating a parameterized line using the slope-intercept idea. Generate two integer x-value sets ranging from −10 to −1 and from 1 to 10, convert them into corresponding point collections, then merge the two collections into one set. Mark a base point on the y-axis at x = 0, and draw a line through this base point and a second point determined by parameters. Add text labels tied to the line’s slope: display a fraction-style fraction of the absolute slope, including a sign indicator depending on whether the slope is positive or negative. Also show a fraction-style label associated with the line’s intercept term, keeping all objects consistent on the same graph.
The prompt above was compiled from the original drawing commands and is for reference only.