
Graphical Solving of Quadratic Equations: Roots from Parabola Intersections
Loading the math board and drawing, please wait…
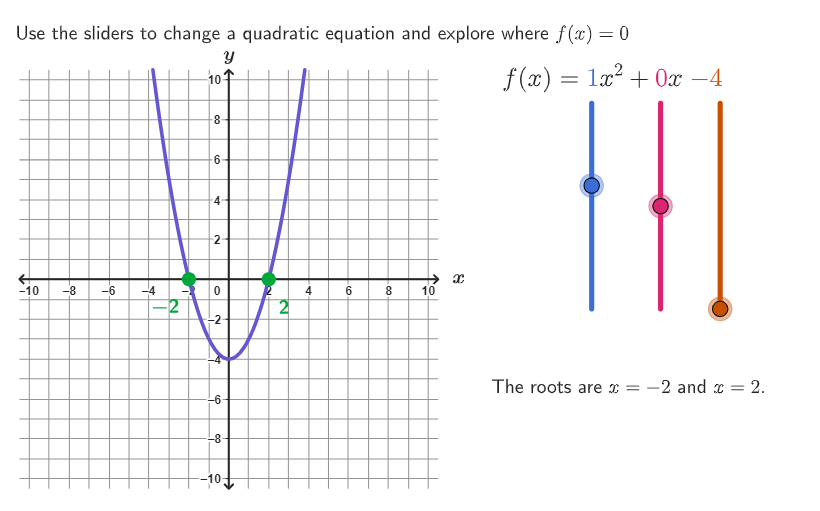
This GeoGebra example lets learners modify a quadratic equation and observe how the parabola’s intersections determine the equation’s roots and their locations. It highlights key ideas: quadratic functions, the relationship between roots and x-intercepts, and how different discriminant cases (two real roots, one real root, no real roots) change the graph’s appearance. The construction uses commands and objects reflected in the provided build summary, including Corner, Polygon, Segment, and Translate to set up geometric/graph layout; Root to mark the solutions; RemoveUndefined to handle cases where solutions do not exist; Text to present questions and labels (e.g., open-ended prompts); and guide/axis-related objects (MoveGuideLine, hGuideline, vGuideline, xAxisFake, yAxisFake) along with parameter/function objects (a, b, c, f, g, and related parameters) to drive the interactive graph. Designed for grades 9–12 and classroom exploration on graphing-based equation solving.
GeoGebra Commands & Parameters
Corner(5) → AppSizePolygon({ViewCorner1_{1}, (x(ViewCorner3_{1}), y(ViewCorner1_{1})), ViewCorner3_{1}, (x(ViewCorner1_{1}), y(ViewCorner3_{1}))}) → q1_{1}Segment((x(ViewCorner1_{1}), 0), (x(ViewCorner3_{1}), 0)) → xAxisFake_{1}Segment((0, y(ViewCorner1_{1})), (0, x(ViewCorner3_{1}))) → yAxisFake_{1}Translate(hGuideline, Vector[(Vector[Corner[1], Corner[4]] / 500 * 16)]) → hGuideline'Root(f) → A, BRemoveUndefined({A, B}) → l2Text(x(A), A + (0, If[a ≥ 0, -0.5, 0]), true, true, If[Length[l2] ≟ 1, 0, -1], If[a ≥ 0, -1, 1]) → text3Text(x(B), B + (0, If[a ≥ 0, -0.5, 0]), true, true, 1, If[a ≥ 0, -1, 1]) → text4Text("x", (11.5, 0.2), true, true, 0, 0) → text1_{1}Text("y", (0, 11.25), true, true, 0, 0) → text2_{1}
AI Drawing Prompt Reference
Draw a parabola opening upwards and adjust its position and shape by changing the values of a, b, and c. Mark the points where the parabola intersects the x-axis as the roots of the equation, and add annotations above or below the roots to indicate their positions. If the parabola does not intersect the x-axis, do not display the annotations. Draw dashed lines for the x-axis and y-axis, and add labels for the x-axis and y-axis at appropriate positions.
The prompt above was compiled from the original drawing commands and is for reference only.