
Graphical Solutions to Linear Inequalities
Loading the math board and drawing, please wait…
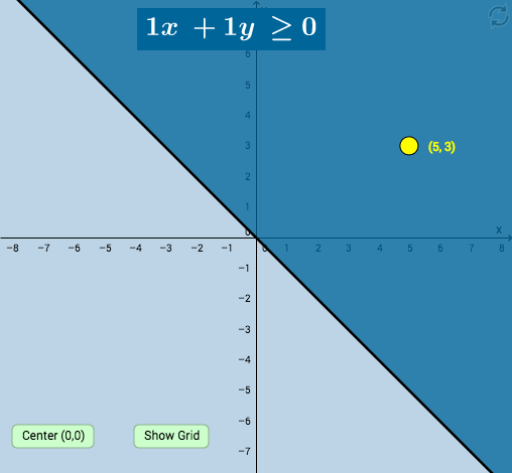
This example visually demonstrates the solutions to linear inequalities through graphical representation. It involves core math concepts like linear inequalities, solution sets, and number line representations. Constructed using GeoGebra commands and objects such as Textfield, Intersect, Slope, and PointIn, it includes input boxes, intersection calculations, slope determination, and point-on-curve checks. Ideal for high school mathematics education, helping students grasp the geometric meaning and solving methods of linear inequalities.
GeoGebra Commands & Parameters
Textfield(a) → InputBox1Textfield(b) → InputBox2Textfield(c) → InputBox3Intersect(f, y = 0) → AIntersect(f, x = 0) → BSlope(f) → mPointIn(e) → SOLPointIn(d) → SOLUTION