
Graphical Representation of Linear Inequalities
Loading the math board and drawing, please wait…
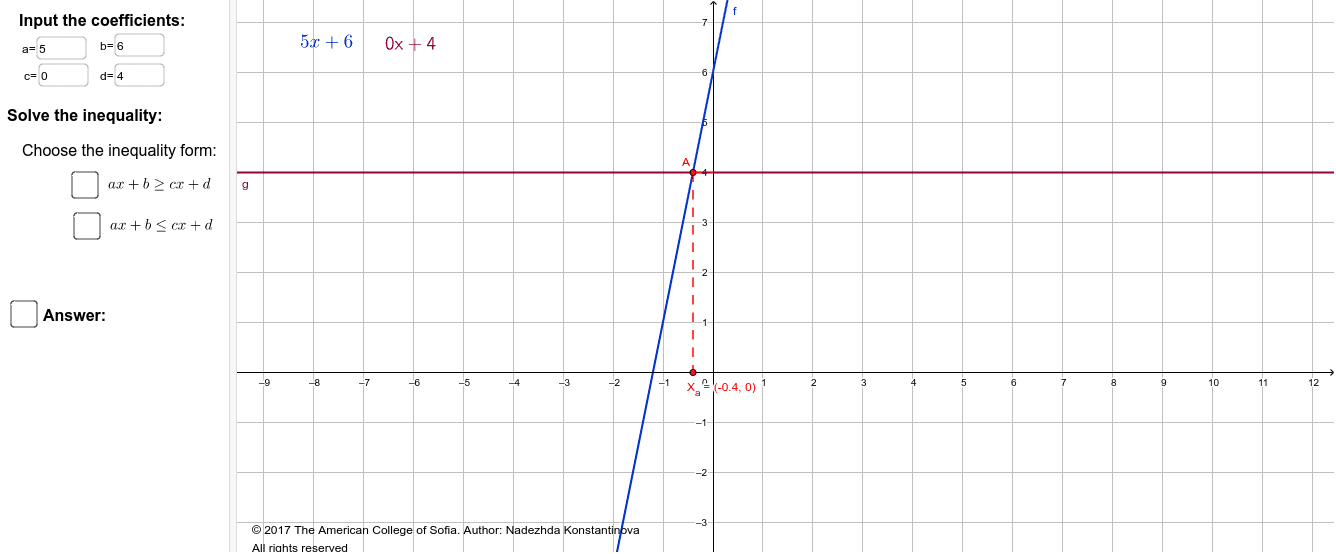
① This GeoGebra example dynamically demonstrates the graphical representation of a linear inequality, allowing users to visually explore the solution region on the coordinate plane. ② Core mathematical concepts include linear inequalities, boundary lines, half-plane solution sets, and how the inequality sign affects the shaded region. ③ Construction highlights: interactive input boxes (Textfield, InputBox) for coefficients, boundary lines and intersection points built with Intersect, Segment, Point, and Ray, conditional shading using If, and multiple text objects for dynamic labels and explanations. ④ Suitable for middle and high school students learning graphical solutions to inequalities, as well as for teacher demonstrations or self-paced exploration, reinforcing the connection between algebra and geometry.
GeoGebra Commands & Parameters
Textfield(a) → InputBox1Textfield(b) → InputBox2Textfield(c) → InputBox3Textfield(d) → InputBox4Intersect(f, g) → ASegment(A, X_a) → hSegment(A, A_y) → iPoint(l) → BRay(X_a, B) → mPoint(p) → CRay(X_a, C) → qRay(X_a, C) → tIf(u > 0, true) → v