
Graphical Representation of Linear Equations with 2 Variables
Loading the math board and drawing, please wait…
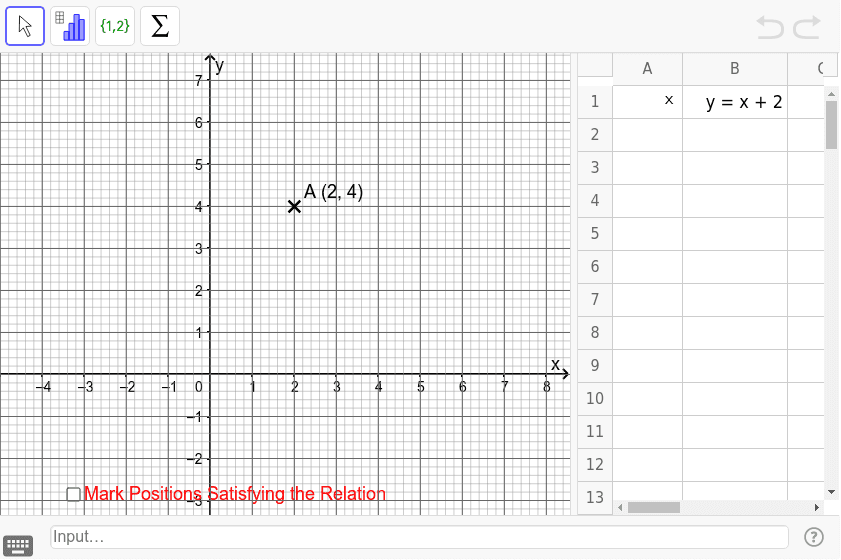
This example visually demonstrates that the set of points satisfying a linear equation forms a straight line in the rectangular coordinate plane. It involves core math concepts like linear equations, coordinate geometry, and function graphing. Construction highlights the use of GeoGebra commands Sequence, Distance, and Intersect, along with objects such as S, T, U, V, int, lists1-4, A, text1, B1, a, A1, b, c, A', and text3. Ideal for high school students learning the geometric interpretation of linear equations.
GeoGebra Commands & Parameters
Sequence(Segment[(x(S) + int * i, y(S)), (x(T) + int * i, y(T))], i, 0, (x(U) - x(T)) / int) → list1Sequence(Segment[(x(T), y(T) + int * i), (x(U), y(U) + int * i)], i, 0, (y(S) - y(T)) / int) → list2Sequence(Segment[(x(S) + int * i / 5, y(S)), (x(T) + int * i / 5, y(T))], i, 0, 5 * (x(U) - x(T)) / int) → list3Sequence(Segment[(x(T), y(T) + int * i / 5), (x(U), y(U) + int * i / 5)], i, 0, 5 * (y(S) - y(T)) / int) → list4Distance(A, B1) → aIntersect(B1, c) → A'
AI Drawing Prompt Reference
Draw a straight line on a 2D plane passing through points A and B1, using points S, T, and U to define the line. First, draw horizontal line segments parallel to the x-axis, then draw vertical line segments parallel to the y-axis. Next, draw 5 short horizontal line segments parallel to the x-axis, and finally, draw 5 short vertical line segments parallel to the y-axis to show the intersection point A' with line c.
The prompt above was compiled from the original drawing commands and is for reference only.