
Graphical Method for Simultaneous Linear Equations
Loading the math board and drawing, please wait…
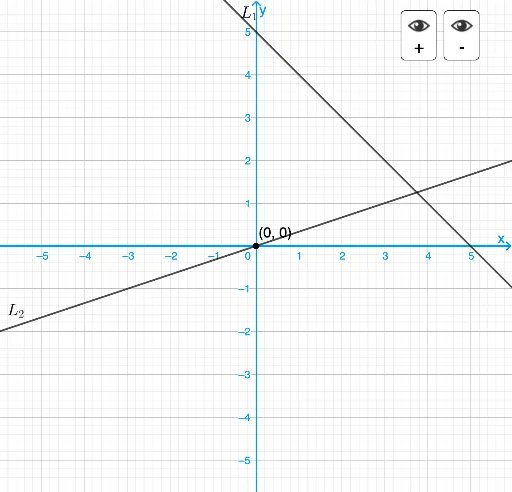
This example demonstrates the graphical method for solving simultaneous linear equations by plotting two lines and identifying their intersection point. Core mathematical concepts include linear equations, graphical representation of lines, and intersection coordinates. It utilizes GeoGebra commands and objects like Textfield, Point, Intersect, DynamicCoordinates, and Segment to dynamically display and calculate the intersection, making it suitable for middle school mathematics education to visually explain the solution of systems of equations and its geometric significance.
GeoGebra Commands & Parameters
Textfield(L1) → InputBox1Textfield(L2) → InputBox2Point({L1, L2}) → P'Intersect(((-(x(L2) / y(L2))) * x) - z(L2) / y(L2), L1, 1) → QDynamicCoordinates(P', If[Distance[P', Q] < d, x(Q), x(P')], If[Distance[P', Q] < d, y(Q), y(P')]) → PSegment(Q, (x(Q), 0)) → fSegment(Q, (0, y(Q))) → g