
Graphical Demonstration of Complex Number Addition
Loading the math board and drawing, please wait…
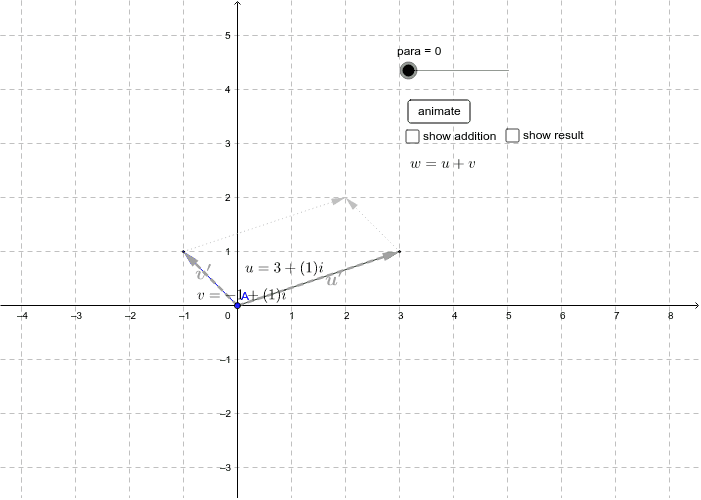
This example visually demonstrates the addition of two complex numbers using geometric methods. Key math concepts include the geometric representation of complex numbers, vector addition, and the parallelogram law. GeoGebra commands and objects like Point, Vector, Translate, Segment, Intersect, and Midpoint are used to construct vectors, parallelograms, and intersection points. Suitable for high school students learning about complex number addition and its geometric interpretation.
GeoGebra Commands & Parameters
Point(yAxis) → AVector(A, B) → vVector(A, C) → uTranslate(A'', u) → A'''Segment(A'', A''') → iTranslate(A', v) → B'Segment(A', B') → jIntersect(i, j) → XMidpoint(A, B) → DMidpoint(C, A) → EVector(A', B') → v'Midpoint(A', B') → FVector(A, X) → wVector(A'', A''') → u'Midpoint(A'', A''') → GTranslate(C, v) → C'Vector(C, C') → kTranslate(B, u) → B'_1Vector(B, B'_1) → l
AI Drawing Prompt Reference
Draw a graphical demonstration of complex number addition. Include points A, B, C, X, D, E, F, G and vectors v, u, v', w, u', k, l. The figure should illustrate the geometric representation of complex number addition, vector addition, and the parallelogram law. Construct parallelograms, intersection points, and midpoints to show the geometric meaning of complex number addition.
The prompt above was compiled from the original drawing commands and is for reference only.