
Graphical Demo of Pythagoras' Theorem
Loading the math board and drawing, please wait…
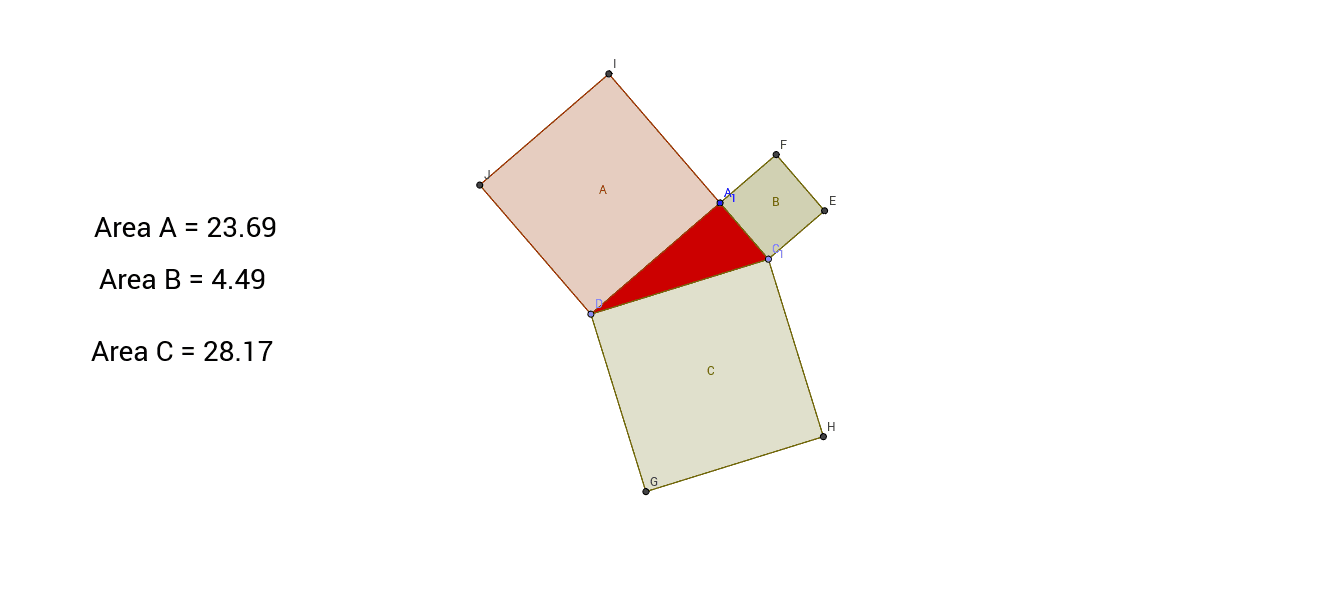
This example visually demonstrates Pythagoras' Theorem, illustrating the relationship between the squares of the sides of a right triangle. Core math concepts include Pythagoras' Theorem (A²+B²=C²) and right triangles. It is constructed using GeoGebra commands like Line, OrthogonalLine, Point, and Polygon. Ideal for middle school and above students to grasp the geometric meaning and application of Pythagoras' Theorem.
GeoGebra Commands & Parameters
Line(A_1, B_1) → aOrthogonalLine(A_1, a) → bPoint(b) → C_1Point(a) → DPolygon(A_1, C_1, D) → poly1, d, a_1, cPolygon(A_1, C_1, 4) → B, a_2, c_1, e, f, E, FPolygon(C_1, D, 4) → C, c_2, d_1, g, h, G, HPolygon(D, A_1, 4) → A, d_2, a_3, i, j, I, J
AI Drawing Prompt Reference
Draw a right triangle and label its vertices. Then, draw two squares on the two legs of the triangle, and another square on the hypotenuse, demonstrating the Pythagorean theorem where the sum of the areas of the two smaller squares equals the area of the largest square. Use distinct colors and lines to differentiate the squares and the triangle, constructing the triangle first, then the squares on the legs, and finally the square on the hypotenuse.
The prompt above was compiled from the original drawing commands and is for reference only.