
Graphic Resolution of Nonlinear System of Equations
Loading the math board and drawing, please wait…
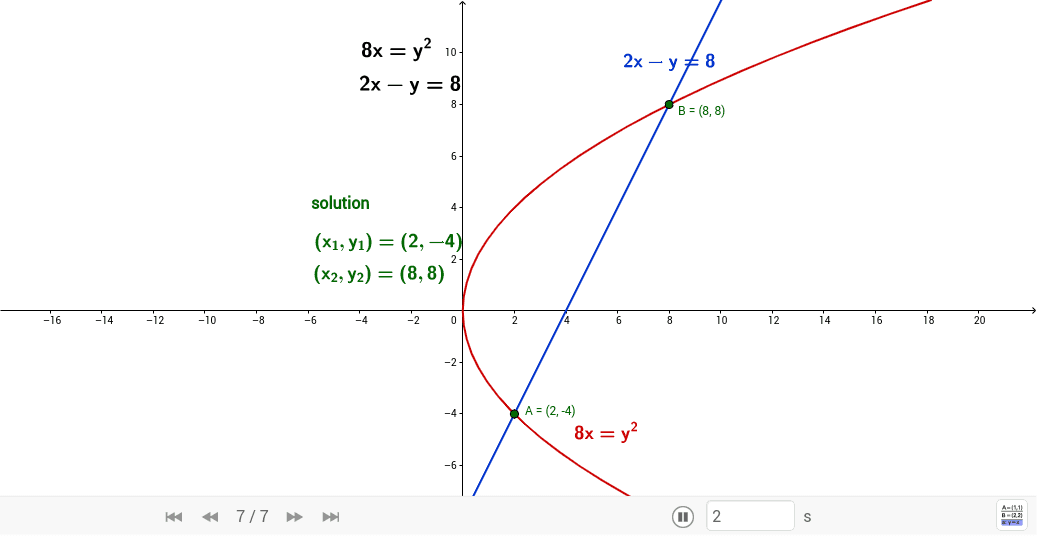
This example demonstrates how to solve a nonlinear system of equations graphically by finding the intersection points of the equations. Key math concepts include systems of equations, nonlinear functions, graphical intersections, and analytical geometry. The construction uses GeoGebra commands like Intersect and objects such as texto1, texto2, c, a, texto3, texto4, A, B, texto5, texto6, texto7 for text and points. Suitable for high school and above mathematics education to understand graphical solutions and intersection calculations.
GeoGebra Commands & Parameters
Intersect(c, a) → A, B
AI Drawing Prompt Reference
Draw the graphs of two nonlinear functions and label their intersection points, with text indicating the coordinates of the points, demonstrating how to solve a nonlinear system of equations graphically.
The prompt above was compiled from the original drawing commands and is for reference only.