
Graph y = a sin(x) + d Sinusoidal Wave
Loading the math board and drawing, please wait…
In collections
Geometry Applets
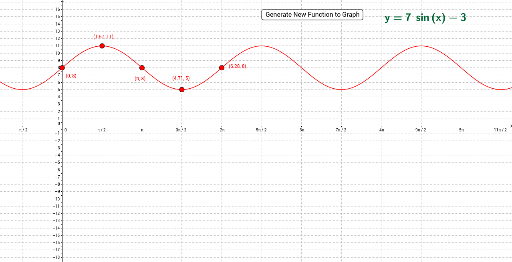
This example demonstrates how to draw the sinusoidal wave y = a sin(x) + d by dragging five key points. Core math concepts include sine function, amplitude a, phase shift d, and periodicity. Key GeoGebra commands used are Sequence, Union, RandomElement, Point, and FitSin to construct key points and fit the sine wave. Suitable for high school mathematics teaching to understand the impact of parameters on the sine wave graph.
GeoGebra Commands & Parameters
Sequence(i, i, -8, -1, 1) → Lista_1Sequence(i, i, 1, 8) → Lista_2Union(Lista_1, Lista_2) → ListaSequence(i, i, -8, 8, 1) → ListdRandomElement(Listd) → sPoint(a) → APoint(b) → BPoint(c) → CPoint(d) → DPoint(e) → EFitSin(list1) → h
AI Drawing Prompt Reference
Draw a sinusoidal wave graph y = a sin(x) + d by dragging five key points to demonstrate the wave's variation. The graph is generated by the sine function, showing the impact of amplitude a and phase shift d. Start by creating integer sequences from -8 to 8, merge them, randomly select a point as a base, then use it to plot other key points, and finally fit a sine wave through these points.
The prompt above was compiled from the original drawing commands and is for reference only.