
Graph Transformation: mf(x)+c
Loading the math board and drawing, please wait…
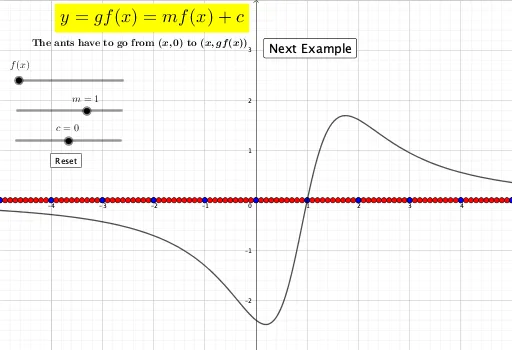
This example demonstrates how to transform the graph of f(x) by changing parameters m and c. Key mathematical concepts include function graph translation and scaling. It uses Sequence, Function, X, Q, button1, g, Z, S, eg, button2, text3, text2, text4, text5, text6, xl, xr, yt, yb commands in GeoGebra. Suitable for high school math education and learning.
GeoGebra Commands & Parameters
Sequence(-5 + (0.1 * i), i, 0, 100) → XSequence(-5 + i, i, 0, 10) → Z
AI Drawing Prompt Reference
In a coordinate plane, first create two point sequences to serve as x-samples for drawing function graphs. The first sequence starts at x = -5, uses a step of 0.1, and continues up to x = 5 (about 101 points); treat these values as the first x-coordinate set. The second sequence also starts at x = -5, uses a step of 1, and goes up to x = 5 (about 11 points); treat these as a second x-coordinate set. Then construct the corresponding function graph(s) based on these sampled x-values to illustrate how changing parameters affects the graph shape, keeping focus on the interval [-5, 5].
The prompt above was compiled from the original drawing commands and is for reference only.