
Graph Shape Linked to the Signs of the First Two Derivatives
Loading the math board and drawing, please wait…
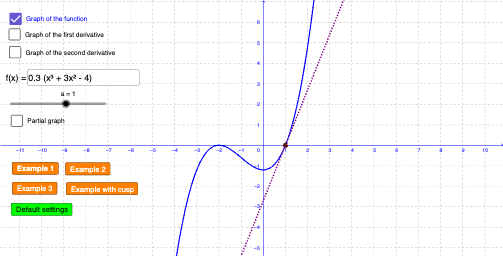
This example demonstrates how the overall shape of a function’s graph is determined by the signs of its first and second derivatives: the sign of the first derivative indicates increasing/decreasing behavior, while the sign of the second derivative indicates concavity (and helps explain how curvature changes near inflection points). Key concepts include first and second derivatives, tangent-line slope, monotonicity, concavity/convexity, and the qualitative interpretation of derivative signs on the graph. The construction is interactive and uses GeoGebra objects to display both the function and derivative information: Vector and Textfield are used for vector/tangent-style annotations and explanatory labels, while toggling/display controls such as pokazfunkcje, pokazpochodna, and pokazwykresdrugiejpochodnej show the function, the first derivative, and the second-derivative graph/markers. InputBox1 and multiple buttons plus text objects (e.g., tekst8/tekst9 and other text fields) organize the visualization and user interaction. Suitable for high school and early undergraduate calculus lessons, especially for building intuition between derivative signs and graph behavior.
GeoGebra Commands & Parameters
Vector((-6, 0), (6, 0)) → uVector((0, -2), (0, 6)) → vTextfield(f) → InputBox1
AI Drawing Prompt Reference
Draw a function graph with its first and second derivatives. Include a function curve, a first derivative curve, and a second derivative curve. Use arrows and text labels to explain slope and concavity. Users can toggle display of function, first derivative, and second derivative. The graph should visually show how derivative signs affect the shape of the function.
The prompt above was compiled from the original drawing commands and is for reference only.