
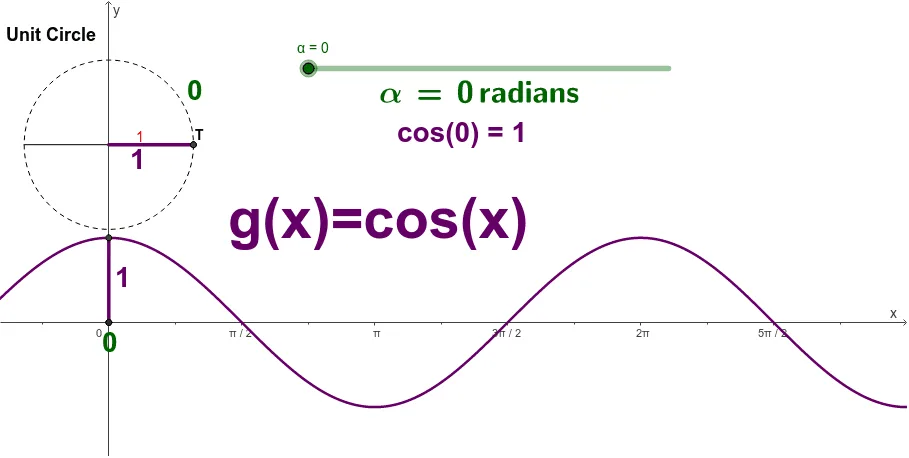
Graph of g(x) = cos(x) Generated from the Unit Circle
Loading the math board and drawing, please wait…
① This example dynamically shows how the graph of the cosine function g(x) = cos(x) is generated from the unit circle, linking circular motion to the trigonometric curve. ② Core mathematical concepts include the unit circle, trigonometric functions (cosine), angle measure in radians and degrees, right triangles, and the ratio of adjacent side to hypotenusehol. ③ Construction highlights: using GeoGebra commands such as Circle, Point, Rotate, OrthogonalLine, Intersect, Segment, Distance, and Parametric Curves to trace the cosine graph as a point moves around the circle; objects include the unit circle, rotating point, perpendicular lines, intersections, arcs, and angle displays. ④ Suitable for high school or introductory college trigonometry, this interactive construction helps students visualize the periodic nature, domain, and range of the cosine function and its connection to the unit circle.
GeoGebra Commands & Parameters
Line(B, O) → aCircle(O, 1) → cIntersect(c, a, 2) → CRotate(C, α, O) → DOrthogonalLine(D, a) → eIntersect(a, e) → AAngle(C, O, D) → βSegment(O, D) → bDistance(D, a) → dSegment(A_1, D_1) → hMidpoint(O, A) → EMidpoint(A_1, D_1) → FPoint(xAxis) → GSegment(G, A_1) → iIntersect(c, a, 2) → HIntersect(c, a, 1) → ISegment(I, H) → jCircleArc(O, J, D) → kSegment(A, O) → lSegment(O, A) → gSegment(A, D) → m