
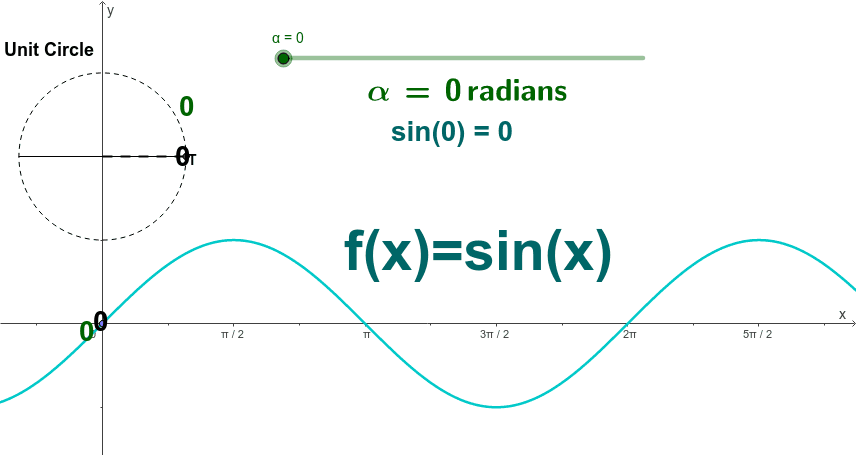
Graph of f(x) = sin(x) from the Unit Circle
Loading the math board and drawing, please wait…
This example demonstrates how the graph of f(x) = sin(x) is derived from the unit circle. Key mathematical concepts include trigonometry and the unit circle. Using GeoGebra commands such as Point, Line, Circle, Intersect, Rotate, etc., the example dynamically shows the changes in sine values. Suitable for high school math education, aiding students in understanding the relationship between the sine function and the unit circle.
GeoGebra Commands & Parameters
Point(yAxis) → OLine(B, O) → aCircle(O, 1) → cIntersect(c, a, 2) → CRotate(C, α, O) → DCircleArc(O, J, D) → kAngle(C, O, D) → βSegment(O, D) → bDistance(D, a) → dOrthogonalLine(D, a) → eIntersect(a, e) → ALength(k) → RadianAlphaSegment(D, A) → gSegment(A_1, D_1) → hMidpoint(D, A) → EMidpoint(A_1, D_1) → FPoint(xAxis) → GSegment(G, A_1) → iIntersect(c, a, 2) → HIntersect(c, a, 1) → ISegment(I, H) → jSegment(O, A) → l
AI Drawing Prompt Reference
Draw the unit circle and the graph of the sine function in the coordinate system. Start by drawing point O on the y-axis, then draw a vertical line a through O. Draw a circle c with O as the center and a radius of 1. Rotate the intersection point C of circle c and line a to get point D, then draw arc k from O to D and line segment b from O to D. Draw a perpendicular line e from D to a, and the intersection point is A. Draw line segment g from O to A, and line segment h from A to D. Find the intersection point G of line segment b and the x-axis, then draw line segment i from G to A. Finally, draw line segment j between the intersection points H and I of circle c and line a, and line segment l from O to A.
The prompt above was compiled from the original drawing commands and is for reference only.