
Graph of Cosine from Wrapping Function by Doug Kuhlmann
Loading the math board and drawing, please wait…
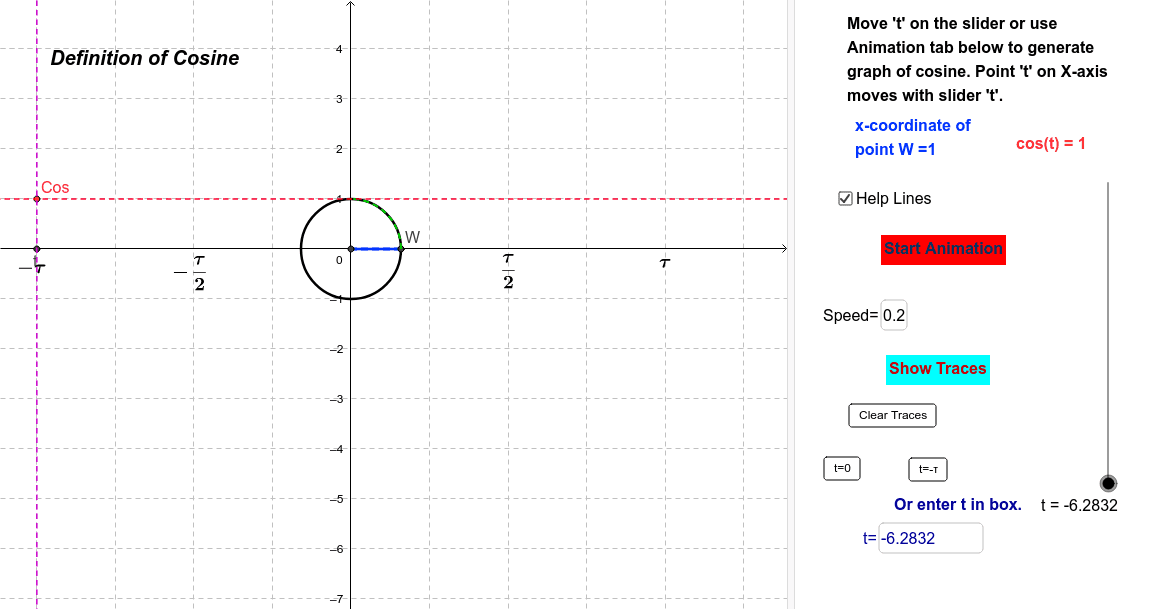
This example demonstrates the graph of the cosine function through a wrapping function. Key mathematical concepts include trigonometry and coordinate geometry. It uses commands like Circle, Arc, Intersect, and Textfield in GeoGebra. Suitable for high school mathematics education, particularly in coordinate geometry and trigonometry.
GeoGebra Commands & Parameters
Intersect(xAxis, yAxis) → ACircle(A, 1) → cOrthogonalLine(W, xAxis) → aIntersect(xAxis, a) → BSegment(B, W) → bSegment(B, A) → dSegment(A, W) → eTextfield(speed) → SPDTextfield(t) → tEqIf(togTr ≟ 1, "Stop Traces", "Show Traces") → ControlTracesIf(togA ≟ 1, "Stop Animation", "Start Animation") → ToggleAnimationCircle(A, B) → hMod(t, 1.5707963267948966) → tmCircle((0, 0), abs(cos(t))) → kArc(k, (cos(t), 0), (0, cos(t))) → p