
Graph of a Derivative
Loading the math board and drawing, please wait…
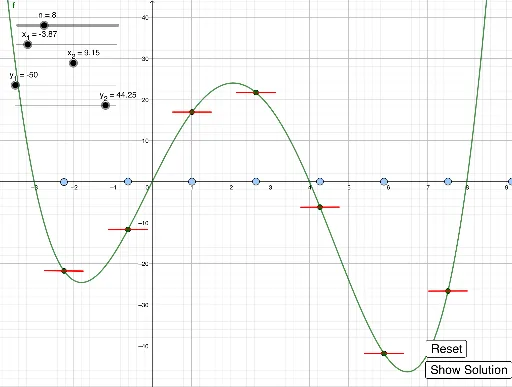
This example demonstrates the graph of a derivative. It involves the core mathematical concept of derivatives. Using GeoGebra commands such as Sequence, Element, Point, Zip, If, and NDerivative, the graph of the derivative of a function can be constructed. Suitable for high school and above students to learn about derivatives and their graphical representation.
GeoGebra Commands & Parameters
Sequence(x_1 + (i * w), i, 1, n) → xvalsElement(xvals, A50) → B50Point(x = B50) → C50Element(xvals, A49) → B49Point(x = B49) → C49Element(xvals, A48) → B48Point(x = B48) → C48Element(xvals, A47) → B47Point(x = B47) → C47Element(xvals, A46) → B46Point(x = B46) → C46Element(xvals, A45) → B45Point(x = B45) → C45Element(xvals, A44) → B44Point(x = B44) → C44Element(xvals, A43) → B43Point(x = B43) → C43Element(xvals, A42) → B42Point(x = B42) → C42Element(xvals, A41) → B41Point(x = B41) → C41Element(xvals, A40) → B40Point(x = B40) → C40Element(xvals, A39) → B39Point(x = B39) → C39Element(xvals, A38) → B38Point(x = B38) → C38Element(xvals, A37) → B37Point(x = B37) → C37Element(xvals, A36) → B36Point(x = B36) → C36Element(xvals, A35) → B35Point(x = B35) → C35Element(xvals, A34) → B34Point(x = B34) → C34Element(xvals, A33) → B33Point(x = B33) → C33Element(xvals, A32) → B32Point(x = B32) → C32Element(xvals, A31) → B31Point(x = B31) → C31Element(xvals, A30) → B30Point(x = B30) → C30Element(xvals, A29) → B29Point(x = B29) → C29Element(xvals, A28) → B28Point(x = B28) → C28Element(xvals, A27) → B27Point(x = B27) → C27Element(xvals, A26) → B26Point(x = B26) → C26Element(xvals, A25) → B25Point(x = B25) → C25Element(xvals, A24) → B24Point(x = B24) → C24Element(xvals, A23) → B23Point(x = B23) → C23Element(xvals, A22) → B22Point(x = B22) → C22Element(xvals, A21) → B21Point(x = B21) → C21Element(xvals, A20) → B20Point(x = B20) → C20Element(xvals, A19) → B19Point(x = B19) → C19Element(xvals, A18) → B18Point(x = B18) → C18Element(xvals, A17) → B17Point(x = B17) → C17Element(xvals, A16) → B16Point(x = B16) → C16Element(xvals, A15) → B15Point(x = B15) → C15Element(xvals, A14) → B14Point(x = B14) → C14Element(xvals, A13) → B13Point(x = B13) → C13Element(xvals, A12) → B12Point(x = B12) → C12Element(xvals, A11) → B11Point(x = B11) → C11Element(xvals, A10) → B10Point(x = B10) → C10Element(xvals, A9) → B9Point(x = B9) → C9Element(xvals, A8) → B8Point(x = B8) → C8Element(xvals, A7) → B7Point(x = B7) → C7Element(xvals, A6) → B6Point(x = B6) → C6Element(xvals, A5) → B5Point(x = B5) → C5Element(xvals, A4) → B4Point(x = B4) → C4Element(xvals, A3) → B3Point(x = B3) → C3Element(xvals, A2) → B2Point(x = B2) → C2Element(xvals, A1) → B1Point(x = B1) → C1Zip(y(A), A, L_2) → usrslopesZip((a, f(a)), a, xvals) → pointsZip(x(A) - w2, A, points) → x_{lower}Zip(x(A) + w2, A, points) → x_{upper}If(t > 0, Zip[(t * f'(x(A))), A, points], usrslopes) → derivativesZip(y(A) + (d * (x(A) - x_1)), A, points, x_1, x_{upper}, d, derivatives) → y_{upper}Zip(y(A) + (d * (x(A) - x_1)), A, points, x_1, x_{lower}, d, derivatives) → y_{lower}Zip(Segment[(x_1, y_1), (x_2, y_2)], x_1, x_{lower}, x_2, x_{upper}, y_1, y_{upper}, y_2, y_{lower}) → L_1Zip((x(A), d), A, points, d, derivatives) → f_{prime}Zip((x(A), 0), A, points) → xaxisptsZip(Vector[A, A + (t * (B - A))], A, xaxispts, B, f_{prime}) → vectorsNDerivative(f) →NDerivative(f) →
AI Drawing Prompt Reference
Draw the graph of a function's derivative by first generating a series of x-values, then finding the corresponding function values for these x-values, and plotting points accordingly. Finally, connect these points with lines to show the derivative graph.
The prompt above was compiled from the original drawing commands and is for reference only.