
Geometric Exploration of Limits
Loading the math board and drawing, please wait…
In collections
MATH1052-edX
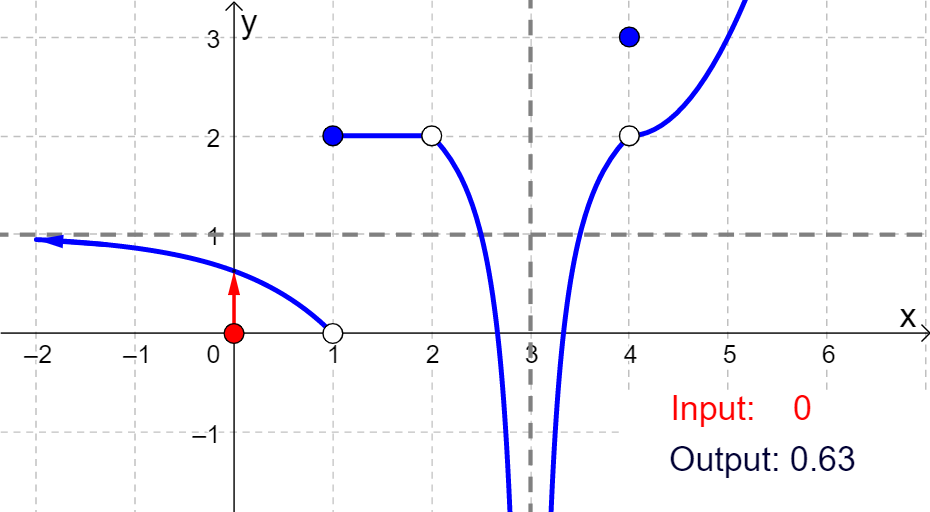
This example uses geometric shapes to demonstrate the concept of limits. It involves exponential functions, probability, and variance. Using GeoGebra commands such as Point, Polygon, and Vector, users can dynamically explore these concepts. Suitable for high school mathematics education and learning.
GeoGebra Commands & Parameters
Point(xAxis) → HPolygon(K, L, M, N) → poly1, k, l, m, nVector(H, (x(H), f(x(H)))) → aVector((x(H), f(x(H))), (0, f(x(H)))) → bVector((5.5, f(5.5)), (5.7, f(5.7))) → vVector((-1.3, f(-1.3)), (-2, f(-2))) → u
AI Drawing Prompt Reference
Plot the graph of an exponential function f(x) on the coordinate plane. Select a moving point H on the x-axis, draw a vector from H to the corresponding point on the function curve at (x(H), f(x(H))), then create a horizontal vector from that point to the y-axis, forming a right triangle representing the function value. On the interval from x=5.5 to 5.7 and from x=-1.3 to x=-2 on the function curve, draw two secant line vectors to demonstrate how secant lines approach the tangent line in the limit process. Form a polygon using four points K, L, M, and N that relates geometrically to the function curve, visually illustrating the relationship between limits, functions, and probability.
The prompt above was compiled from the original drawing commands and is for reference only.