
Geometric Construction of Rational Numbers via Ellipse, Slope Differences
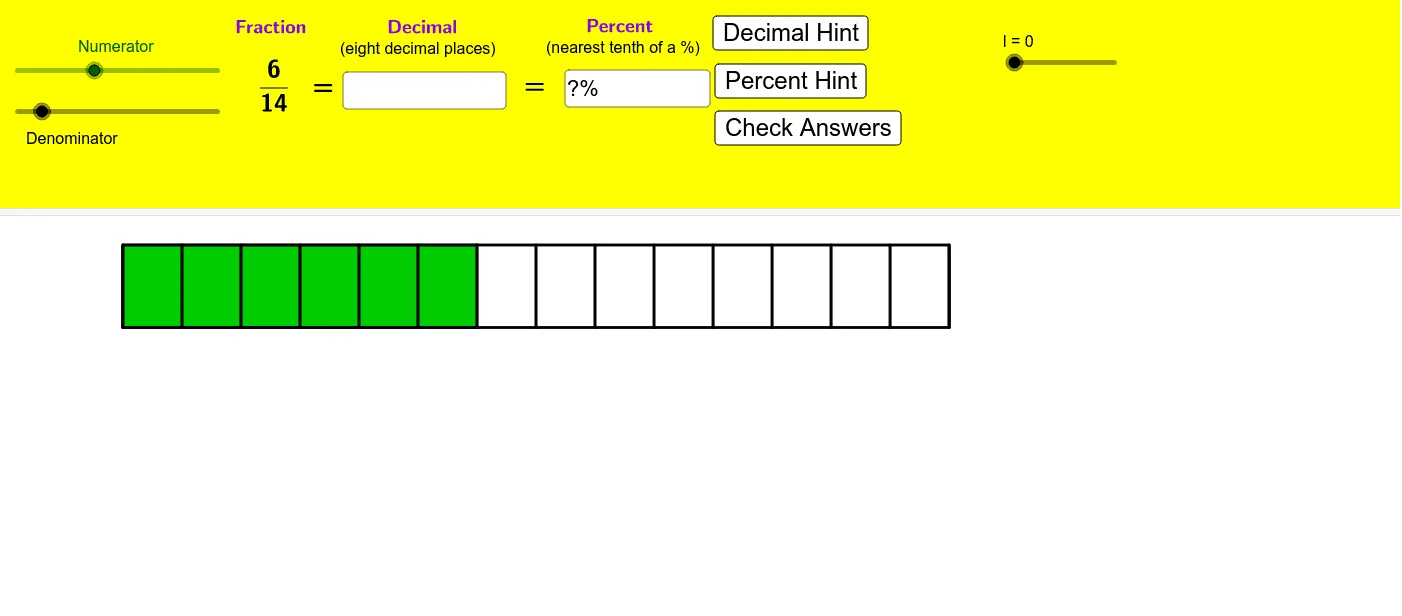
Loading the math board and drawing, please wait…
This GeoGebra example illustrates how rational-number relationships can be visualized and constructed using geometry. By creating intersecting points and polygonal configurations (with translated copies), it highlights a link between slope/difference ideas and distance-based (Pythagoras-type) relationships, emphasizing the constructibility of rational quantities from geometric constraints. The main concepts include Rational Numbers, coordinate geometry, slope and difference representation, and Pythagorean-theorem-related distance-squared structure, with a statistics-oriented perspective for observing patterns from multiple configurations. Construction-wise, it uses Intersect to define key points (e.g., A, B, C, D and their derived versions), Polygon to form the geometric regions (poly1, poly2 and variants), Sequence to generate point lists (list1–list3, list4–list7), Vector together with Translate to build shifted copies (A', B', C', D', poly1', poly2' and related points), and If plus Textfield/Text to conditionally display computed values or annotations. Suitable for middle and high school students learning analytic geometry and geometric construction, and for visualization in math enrichment or modeling activities.
GeoGebra Commands & Parameters
Intersect(xAxis, yAxis) → APolygon(B, A, C, D) → poly1, b, a, c, dSequence((x(A) + (i * a / e), y(A)), i, 0, e) → list1Sequence((x(B) + (i * a / e), y(B)), i, 0, e) → list2Sequence(Segment[Element[list2, i], Element[list1, i]], i, 1, e + 1) → list3Polygon(A, B, Element[list2, f + 1], Element[list1, f + 1]) → poly2, a_1, b_1, g, hVector(A, E) → uTranslate(poly2, Vector[(u * l)]) → poly2'Translate(B, Vector[(u * l)]) → B'Translate(A, Vector[(u * l)]) → A'Translate(C, Vector[(u * l)]) → C'Translate(D, Vector[(u * l)]) → D'Polygon(B', A', C', D') → poly1', b', a', c', d'Sequence((x(A') + (i * a / 100), y(A')), i, 1, 100) → list4Sequence((x(B') + (i * a / 100), y(B')), i, 1, 100) → list5Sequence(Segment[Element[list5, i], Element[list4, i]], i, 1, 100 + 1) → list6Sequence(Segment[Element[list5, (i * 10)], Element[list4, (i * 10)]], i, 1, 100 + 1) → list7Sequence(Text[((n - 1) * 100 / 10) + "%", A' + (((n - 1) * a / 10) - 0.2, -0.4)], n, 1, 10 + 1) → list8If(j ≟ 0 ∨ l ≟ 1, false, true) → kTextfield(n) → InputBox1Textfield(text9) → InputBox2Text(p + "%") → text10Sequence((x(A) + (i * a / 100), y(A)), i, 1, 100) → list9Sequence(Element[list9, (i * 5)], i, 1, 100) → list10Sequence(Text[n / 20, A + ((n * a / 20) - 0.27, -0.4)], n, 1, 19) → list11
AI Drawing Prompt Reference
Draw a geometric figure illustrating rational number relationships. The figure includes points A, B, C, D defined by intersection. Create polygons poly1 and poly2, and their translated copies poly1' and poly2'. Generate sequences of points to show slope and difference. Add text annotations with computed values. The construction order is: define points, create polygons, generate sequences, then translate and annotate.
The prompt above was compiled from the original drawing commands and is for reference only.