
Geogebra Geometry & Statistics Demo
Loading the math board and drawing, please wait…
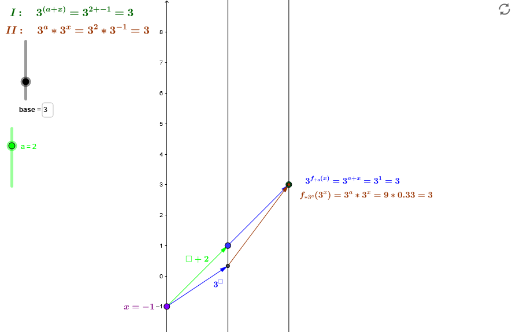
This example demonstrates geometric relationships and statistical calculations through dynamic diagrams involving vectors, points, text, and function graphs; Core math concepts include vector operations, standard deviation, hypothesis testing, and calculus derivatives; Construction uses commands/objects like Point, Vector, Textfield for interactive data input and visualization; Suitable for high school and above mathematics teaching, covering function graphing, statistical analysis, and geometric transformation education.
GeoGebra Commands & Parameters
Point(yAxis) → AVector(A, B) → uVector(B, C) → vTextfield(f1) → inputBox1Textfield(f2) → inputBox2Textfield(f3) → inputBox3Textfield(m) → inputBox4_1Vector(A, F) → iVector(F, C) → hPoint(yAxis) → HVector(H, I) → qVector(H, K) → rVector(K, J) → sVector(I, J) → tVector(J, M) → u_1Textfield(base) → inputBox4Vector(I, M) → v_1Vector(M, I) → w_1Vector(H', G') → z_1Vector(H', K') → c_1Vector(K', J') → e_1Vector(G', J') → d_1
AI Drawing Prompt Reference
Draw a geometric diagram involving vectors and points to demonstrate vector operations and geometric transformations. Start by plotting a point on the y-axis, then draw two vectors originating from this point to other points. Add three text fields for data input and plot function graphs. Next, draw another vector from the first point, and then two more vectors from the endpoint. Plot another point on the y-axis and draw two vectors from it to other points. Finally, draw vectors from transformed points to other transformed points to show geometric transformations.
The prompt above was compiled from the original drawing commands and is for reference only.