
GeoGebra Geometric Construction Example: Frequency Distribution and Scaling
Loading the math board and drawing, please wait…
In collections
Mapping Diagrams: From AB to C&DE, Resource
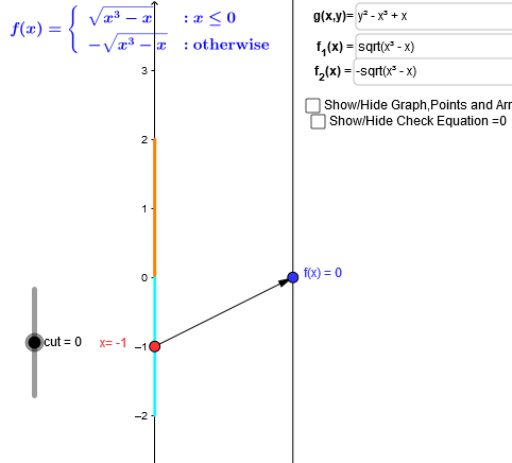
This example demonstrates constructing frequency distribution histograms, cubic curves, and Poisson distribution models using GeoGebra tools, highlighting scaling transformations. Key mathematical concepts include probability statistics, function graph transformations, and geometric construction. Construction involves using Segment, Point, Vector commands to create objects, ImplicitCurve for curve equations, and Sequence for data point sequences. Suitable for high school students learning geometric construction and probability applications, or as a mathematical modeling teaching case.
GeoGebra Commands & Parameters
Segment((0, a_2), (0, 5)) → ePoint(yAxis) → A_1Vector(A_1, B) → uTextfield(f_1) → inputBox1Textfield(f_2) → inputBox2Textfield(f_3) → inputBox3ImplicitCurve(g(x, y)) → hVector(B, E) → vSegment((0, cut), (0, Min[r, a_2])) → dSegment((0, (-r)), (0, Min[r, cut])) → cSequence(Vector[(0, k), (2, f(k))], k, (-r), r, r / n) → list1Sequence((k, f(k)), k, (-r), r, r / n) → list2Textfield(g) → inputBox4Textfield(g) → inputBox5Textfield(f_1) → inputBox6Textfield(f_2) → inputBox7
AI Drawing Prompt Reference
Draw a frequency distribution histogram with a vertical segment and a point, then construct geometric relationships using vectors from the point and another point. Plot a cubic curve and a Poisson distribution model to demonstrate function graph transformations and scaling. Use multiple vectors to define data point sequences, generating the histogram and curve from these sequences, and label the relevant functions and parameters.
The prompt above was compiled from the original drawing commands and is for reference only.