
Geogebra Function & Inequality Demo
Loading the math board and drawing, please wait…
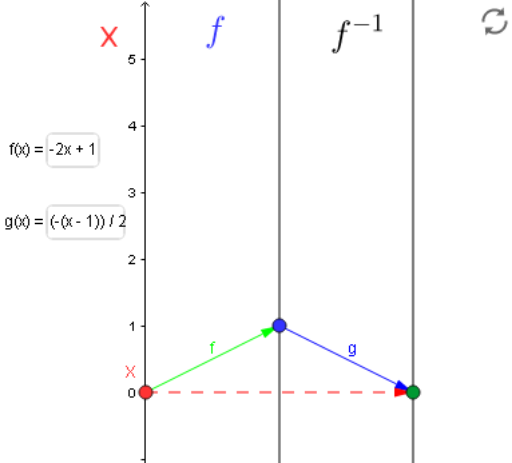
This example demonstrates the graphs of functions f and g and their inequality relationships through dynamic geometry. Core math concepts include functions, inequalities, vectors, and coordinate systems. Construction highlights involve commands like Point, Vector, and Textfield to create points, vectors, and text fields, defining variables a, b, X, and functions f_2, g_2, etc. Suitable for high school mathematics teaching to visually understand function graphs and inequality solution sets.
GeoGebra Commands & Parameters
Point(yAxis) → XVector(X, B) → fVector(B, C) → gTextfield(f_2) → inputBox1Textfield(g_2) → inputBox2Vector(B, D) → vVector(X, C) → u
AI Drawing Prompt Reference
Draw a coordinate system and plot the graphs of two functions, demonstrating their inequality relationships through dynamic geometry. Start by creating a point on the y-axis, then draw a vector from this point to another to represent the first function, and another vector from this second point to a third point for the second function. Include two text boxes for inputting the analytical expressions of the functions. Also, draw two vectors starting from the first point, one pointing to the second point and the other to the third point, to illustrate vector relationships.
The prompt above was compiled from the original drawing commands and is for reference only.