
Geogebra Function & Geometry Exercise
Loading the math board and drawing, please wait…
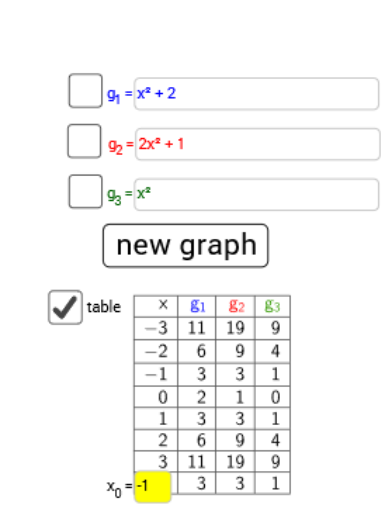
This example demonstrates the integration of function graphs, planes, and conditional probability, involving complex number operations and line segment drawing. Key math concepts include function graphing, complex number addition, conditional probability calculation, and geometric plane representation. Construction highlights use of commands like Random, RandomElement, Textfield, TableText, Point, Button, InputBox, and Locus for interactive and dynamic geometry and function visualization. Suitable for high school mathematics teaching, focusing on the comprehensive application of functions, probability, and complex numbers.
GeoGebra Commands & Parameters
Random(-10, 10) → aRandom(-10, 10) → bRandomElement({-5, -4, -3, -2, -1, 1, 2, 3, 4, 5}) → cTextfield(h) → InputBox1RandomElement({-5, -4, -3, -2, -1, 1, 2, 3, 4, 5}) → a_1Random(-10, 10) → b_1RandomElement({-5, -4, -3, -2, -1, 1, 2, 3, 4, 5}) → c_1Random(-10, 10) → d_1Textfield(m) → InputBox2Textfield(g) → InputBox3Textfield(f) → InputBox4TableText({{A1_1, B_1, C_1, D_1}, {-3, g(-3), h(-3), f(-3)}, {-2, g(-2), h(-2), f(-2)}, {-1, g(-1), h(-1), f(-1)}, {0, g(0), h(0), f(0)}, {1, g(1), h(1), f(1)}, {2, g(2), h(2), f(2)}, {3, g(3), h(3), f(3)}, {1, e, l, k}}, "|_r") → text3_1Point(g_4) → A
AI Drawing Prompt Reference
Draw a function graph with three randomly generated parameters a, b, c, and four input boxes h, m, g, f. Display the values of functions g, h, f at different points, and present these values in a table. Plot point A in the coordinate system, whose coordinates are determined by function g.
The prompt above was compiled from the original drawing commands and is for reference only.