
GeoGebra Example: Functions, Statistics, and Geometric Transformations
Loading the math board and drawing, please wait…
In collections
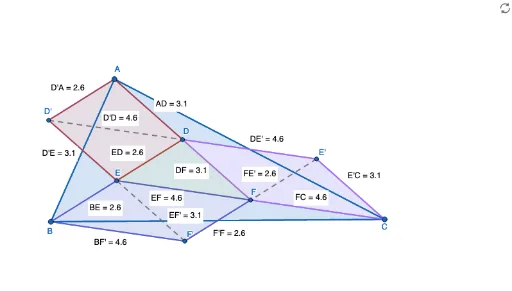
Exploring Feyman's Triangle
This example dynamically demonstrates the relationships between function graphs, secant lines, sine waves, and statistical charts, revealing the intrinsic connection between functions and geometric transformations. Core concepts include function graphing, the relationship between secants and tangents, trigonometric properties, statistical data analysis, and geometric transformations (rotation, dilation). GeoGebra commands and objects used in construction are Segment, Dilate, Intersect, Polygon, Rotate, Distance, Perimeter, and PointIn. Suitable for high school and above learners to understand the integrated application of function properties, geometric transformations, and data analysis.
GeoGebra Commands & Parameters
Segment(A, B) → fSegment(C, B) → gSegment(A, C) → hDilate(C, 1 / 3, A) → C'Dilate(A, 1 / 3, B) → A'Dilate(B, 1 / 3, C) → B'Segment(B, C') → iSegment(A, B') → jSegment(A', C) → kIntersect(k, i) → EIntersect(j, i) → DIntersect(k, j) → FPolygon(B, A, C) → t1, c, b, aPolygon(E, D, F) → t2, f_1, d, eDilate(B, 1 / 2, A) → XDilate(A, 1 / 2, C) → YDilate(B, 1 / 2, C) → ZPolygon(X, E, B) → t3, b_1, x_1, d_1Polygon(Z, F, C) → t4, c_1, z_1, f_2Polygon(D, A, Y) → t5, y_1, e_1, a_1Rotate(X, (-(180°)), X) → X'Rotate(E, (-(180°)), X) → D'Rotate(B, (-(180°)), X) → B'_1Polygon(X', D', B'_1) → t3', b'_1, x', d'Rotate(D, (-(180°)), Y) → E'Rotate(A, (-(180°)), Y) → A'_1Rotate(Y, (-(180°)), Y) → Y'Polygon(E', A'_1, Y') → t5', y', e', a'_1Rotate(Z, (-(180°)), Z) → Z'Rotate(F, (-(180°)), Z) → F'Rotate(C, (-(180°)), Z) → C'_1Polygon(Z', F', C'_1) → t4', c'_1, z', f'Polygon(E, D', A, D) → q1, d_2, l, a_2, e_2Polygon(B, E, F, F') → q2, b_2, d_3, f_3, mPolygon(F, D, E', C) → q3, f_4, e_3, n, c_2Segment(D', D) → pSegment(E', F) → qSegment(F', E) → rDistance(D', A) → distanceD'ADistance(A, D) → distanceADDistance(E, D) → distanceEDDistance(D', E) → distanceD'EDistance(D', D) → distanceD'DDistance(B, E) → distanceBEDistance(E, F') → distanceEF'Distance(B, F') → distanceBF'Distance(D, F) → distanceDFDistance(D, E') → distanceDE'Distance(F, E') → distanceFE'Distance(F, C) → distanceFCPerimeter(q2) → perimeterq2PointIn(q2) → Pointq2Distance(E', C) → distanceE'CDistance(E, F) → distanceEFDistance(F', F) → distanceF'F
AI Drawing Prompt Reference
Draw a function graph and demonstrate its relationship with secant lines, sine waves, and statistical charts. Start by constructing three points and connecting them to form a triangle. Then scale each vertex to create new points and connect them to form new segments. Intersect the segments to find points, and use these points to construct multiple polygons. Rotate some polygons and calculate distances between key points. The final image should include original and rotated polygons, segments, and intersection points, clearly showing the connection between functions, geometric transformations, and statistical data.
The prompt above was compiled from the original drawing commands and is for reference only.