
GeoGebra Demonstration of Continuity and Limits
Loading the math board and drawing, please wait…
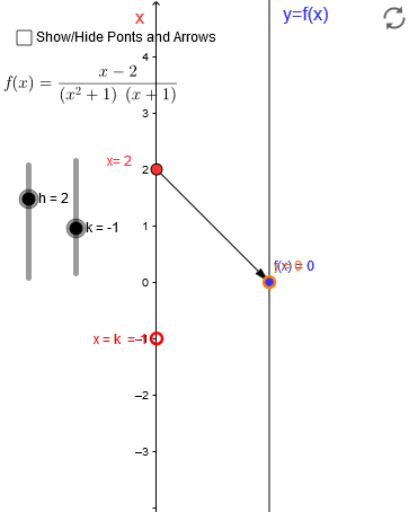
This example dynamically demonstrates the concepts of continuity and limits of a function at a point using GeoGebra. It involves core mathematical concepts such as continuity, percentages, pie charts, conic sections, and limits. The construction utilizes commands and objects like Point, Vector, Textfield, and Sequence, along with sliders and dynamic graphics to illustrate function behavior. Suitable for high school and above students to learn and understand basic calculus concepts, or for mathematical teaching demonstrations.
GeoGebra Commands & Parameters
Point(yAxis) → A_1Vector(A_1, B) → uTextfield(f) → inputBox1Sequence(Vector[(0, i), (2, f(i))], i, k - 2, k + 2, 0.25) → list2Sequence((i, f(i)), i, k - 2, k + 2, 0.25) → list1