
Limits and Continuity Example 1 by S.S.Kaushik
Loading the math board and drawing, please wait…
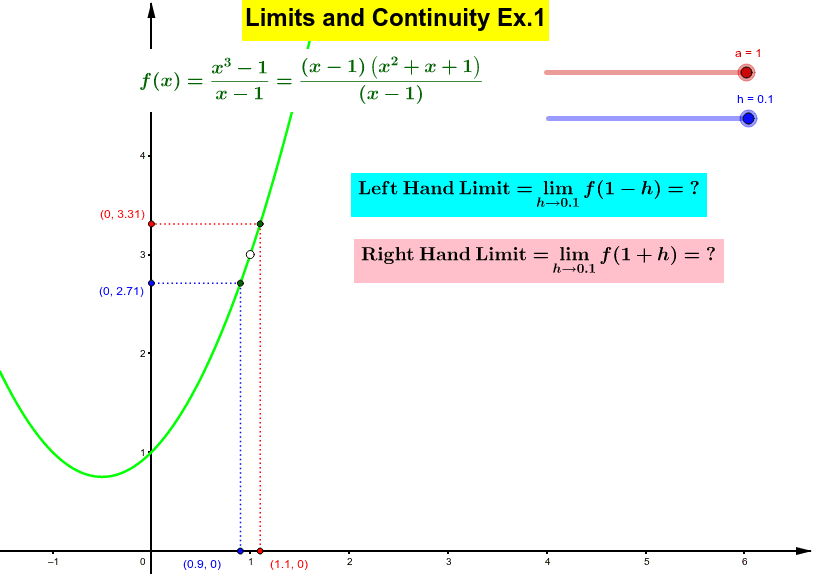
This example demonstrates the behavior of a function with a removable discontinuity at x=1 by allowing the user to drag sliders for variable 'a' and h approaching 0. It involves core calculus concepts like limits and continuity. Constructed using GeoGebra commands such as Segment and Intersect. Suitable for high school and above students learning calculus.
GeoGebra Commands & Parameters
Segment(B, (x(B), 0)) → gSegment(C, (x(C), 0)) → iSegment(B, (0, y(B))) → jSegment(C, (0, y(C))) → kIntersect(g, xAxis) → DIntersect(i, xAxis) → EIntersect(j, yAxis) → FIntersect(k, yAxis) → G
AI Drawing Prompt Reference
Draw a function graph with a removable discontinuity at x=1. Adjust variables a and h using sliders to observe the limit behavior near x=1. First, draw the x-axis and y-axis, then mark the intersection points D, E, F, and G with the graph and axes.
The prompt above was compiled from the original drawing commands and is for reference only.