
GeoGebra Demo: Distributions, Frequency Distribution, and Boxplot
Loading the math board and drawing, please wait…
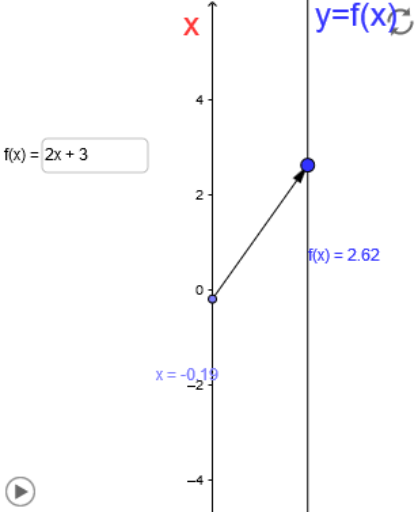
This example demonstrates how to use GeoGebra to plot and analyze probability distributions, frequency distributions, and boxplots. The core math concepts involved include probability distributions, frequency distributions, boxplots, and indefinite integrals. The construction uses commands/objects like Point, Vector, Textfield, and specific elements A, f, B, u, text1, text2, inputBox1, x_0, f_x, a, button1. Suitable for high school and above students to understand statistical and calculus-related concepts.
GeoGebra Commands & Parameters
Point(yAxis) → AVector(A, B) → uTextfield(f) → inputBox1