
GeoGebra Complex Numbers & Statistical Functions Demo
Loading the math board and drawing, please wait…
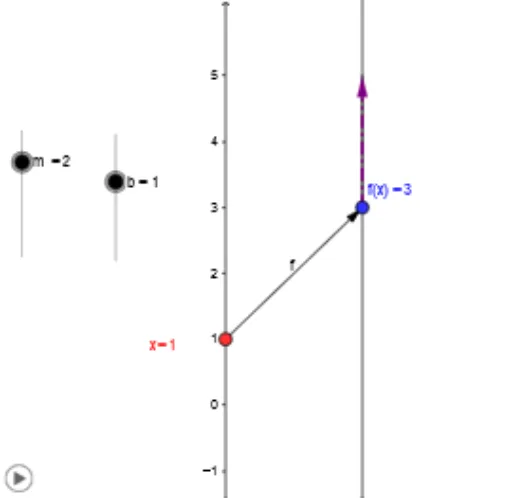
This example demonstrates the visualization of complex number operations and statistical functions (standard deviation, normal distribution). It involves core math concepts: complex numbers, standard deviation, normal distribution, vectors, and function graphing. Construction highlights include commands like Point, Vector, Textfield, Segment, Line, Intersect, and interactive elements inputBox1 and slider. Suitable for high school and above mathematics teaching or introductory data analysis learning.
GeoGebra Commands & Parameters
Point(yAxis) → AVector(A, B) → fTextfield(f_1) → inputBox1Vector(x_1, y_1) → vSegment(f_x, F) → cSegment(E, F) → dSegment(A, x_1) → eSegment(B, y_1) → gSegment(B, y_1) → hLine(x_1, y_1) → iLine(A, B) → kIntersect(i, k) → FocusVector(B, (x(B), y(B) + m)) → rate
AI Drawing Prompt Reference
On a coordinate plane, start with a point on the vertical axis and draw a vector from it to another point, adding an input box for the vector's value. Then, from points on the horizontal and vertical axes, draw segments to a target point, forming two auxiliary lines. Connect these two axis points with a line, and also connect the starting point to the ending point with another line; their intersection marks a focus. Finally, from the ending point, draw a vector upward by a certain distance to represent a rate of change, and add a segment from the focus to a point, plus a segment connecting the two axis points, to illustrate the relationship between complex operations and statistical distribution.
The prompt above was compiled from the original drawing commands and is for reference only.