
Geogebra Algebra & Probability Statistics Example
Loading the math board and drawing, please wait…
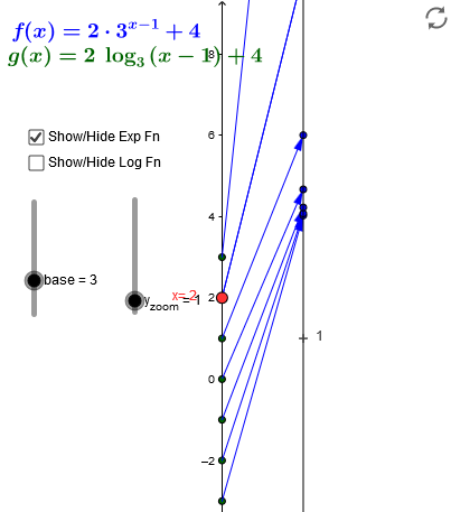
This example demonstrates how to create an interactive model combining algebra and probability statistics using GeoGebra, featuring elements like vectors, textfields, and sequences. Core concepts include binomial distribution, hypothesis testing, matrix operations, and function graphing. Construction highlights involve commands like Point, Vector, Textfield, Sequence, and objects such as n, base, a, h, f, y_{zoom} for parameterized visualization. Suitable for high school and above, ideal for visualizing probability & statistics and linear algebra concepts in education.
GeoGebra Commands & Parameters
Point(yAxis) → A_1Vector(A_1, B) → uTextfield(f) → inputBox1Sequence((0, k), k, -3, 3) → SourcePtsMDSequence((k, f(k)), k, -3, 3) → ExpGraphptsVector(A_1, B_2) → vSequence(Vector[(0, k), (2, (y_{zoom} * f(k)))], k, -3, 3) → ExpMDSequence((2, (y_{zoom} * f(k))), k, -3, 3) → ExpTargPtsSequence(Vector[(2, k), (4, (y_{zoom} * f(k)))], k, -3, 3) → InvLogMDSequence(Vector[(0, base^(k) + 1), (2, (y_{zoom} * g(base^(k) + 1)))], k, -3, 3) → logMDSequence((base^(k) + 1, (2 * k) + n), k, -2, 3) → logGraphpts
AI Drawing Prompt Reference
Create an interactive model combining algebra and probability statistics. Start by plotting a point A on the y-axis, then draw a vector u from A to B. Add a text input box f, and plot a sequence of points from -3 to 3 with y-values k to form SourcePtsMD. Next, plot these points' function values to form ExpGraphpts. Draw another vector v from A to B2, and plot a sequence of points from 0 to 2 with y-values y_{zoom} * f(k) to form ExpMD. Then, plot target points ExpTargPts, and draw a sequence of points from 2 to 4 with y-values y_{zoom} * f(k) to form InvLogMD. Finally, plot points from 0 to 2 with y-values base^(k) + 1 to form logMD, and plot their function values to form logGraphpts.
The prompt above was compiled from the original drawing commands and is for reference only.