
Generating Sine Graph from Unit Circle
Loading the math board and drawing, please wait…
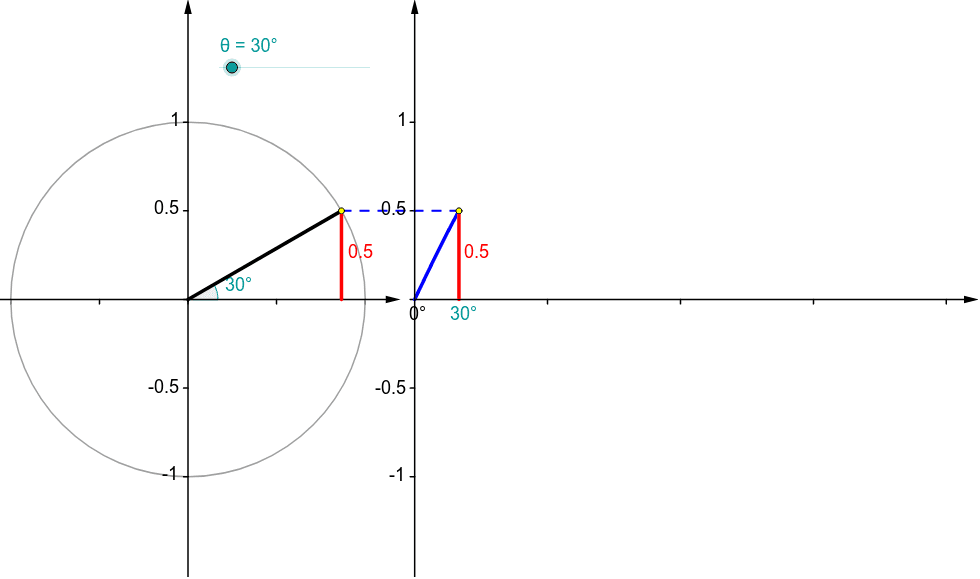
This example demonstrates how to generate a sine graph from a unit circle. By rotating a point and defining angles, sine values are determined, and the sine curve is then plotted using the Function command. Key commands used include Point, Rotate, Angle, Function, Segment, Circle, Vector, and Sequence. Suitable for high school mathematics education and learning.
GeoGebra Commands & Parameters
Point(Ray[(0, 0), (-1, 0)]) → BRotate(A, θ, B) → PRotate(A, θ, B) → A'Angle(A, B, A') → αRotate(A, θ, B) → A'_1Angle(A, B, A'_1) → βFunction(sin(120° * x), 0, x(Q)) → fSegment(Q, (x(Q), 0)) → eCircle(B, A) → cSegment(B, P) → aVector((x(B), y(Corner[1])), (x(B), y(Corner[4]))) → uVector((0, y(Corner[1])), (0, y(Corner[4]))) → wVector((0, 0), (x(Corner[2]), 0)) → zSequence(Segment[(0.75 * i, 0), (0.75 * i, -0.025)], i, 1, 4) → list1Segment(P, (x(P), 0)) → bVector(B - (1.2, 0), B + (1.2, 0)) → vSequence(Segment[(0, 0.5 * i - 1), (-0.025, 0.5 * i - 1)], i, 0, 4) → list2Sequence(Segment[(x(B), 0.5 * i - 1), (x(B) - 0.025, 0.5 * i - 1)], i, 0, 4) → list3Segment(P, Q) → dSequence(Segment[B + (0.5 * i - 1, 0), B + (0.5 * i - 1, -0.025)], i, 0, 4) → list4Point(Ray[(0, 0), (-1, 0)]) → B_1Rotate(A_1, θ, B_1) → P_1Rotate(A_1, θ, B_1) → A'_2Rotate(A_1, θ, B_1) → A'_3Circle(B_1, A_1) → c_1Segment(B_1, P_1) → a_1
AI Drawing Prompt Reference
Draw a unit circle and mark a point on it. Rotate the point to determine sine values through the angle of rotation, and plot the sine curve. Show the rotation process and angle relationships, connect key points with line segments, and represent directions with vectors. Finally, use the function command to plot the curve based on sine values, suitable for high school mathematics education and learning.
The prompt above was compiled from the original drawing commands and is for reference only.