
Generating Data with Desired Correlation: A Statistical Simulation
Loading the math board and drawing, please wait…
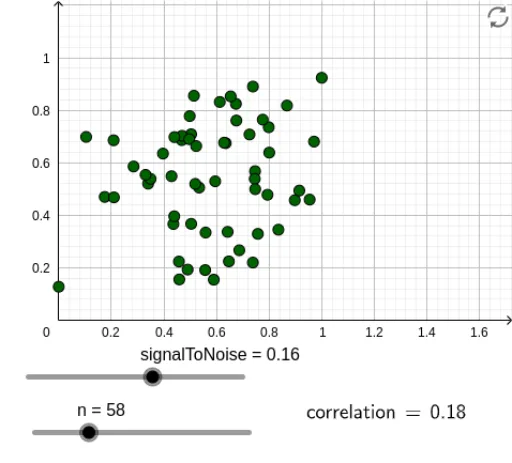
① This example demonstrates how to dynamically generate a set of bivariate data points with a user-specified correlation coefficient in GeoGebra, visually linking the scatter plot to the correlation value. ② Core mathematical concepts include Pearson's product-moment correlation coefficient (PMCC), random variables, noise vs. signal, data normalization, and sequence generation. ③ Construction highlights: the Normalize command standardizes signal and noise, Sequence generates data arrays, PMCC computes the correlation, and a slider (signalToNoise) adjusts the signal-to-noise ratio to control the final correlation; objects include data, noise, l1, correlation1, A, refinedSignal, l2, correlation, B, f, and text1, which update the plot and numerical readout dynamically. ④ Suitable for high school and undergraduate statistics courses to illustrate correlation concepts, and for teachers to demonstrate how random data generation and statistical measures interact, helping students understand that correlation is not fixed but depends on the underlying data generation mechanism.
GeoGebra Commands & Parameters
Normalize(Sequence[RandomNormal[0.5, 0.2], k, 1, n]) → dataSequence(RandomUniform[-0.5, 0.5], k, 1, n) → noisePMCC(l1) → correlation1PMCC(l2) → correlationLaTeX(correlation, true, true) → text1