
Gamma Distribution Interactive: Adjust α and β to See Curve Changes
Loading the math board and drawing, please wait…
In collections
JHU EN.550.311 Spring 2014
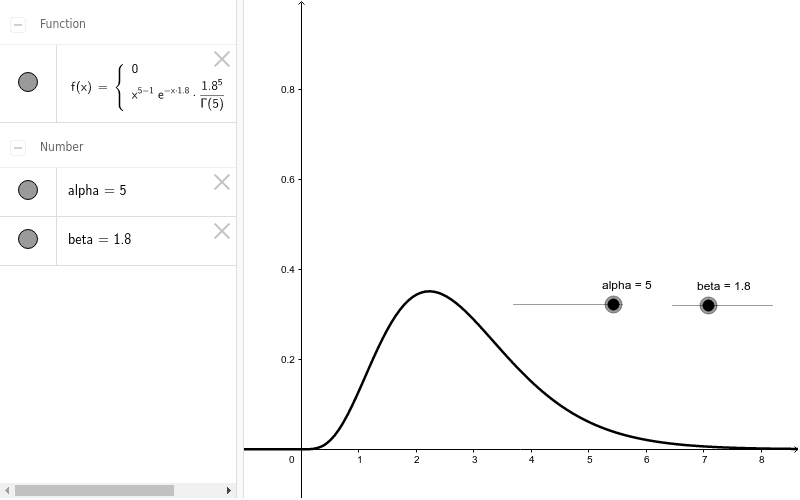
① This example demonstrates how the gamma distribution's probability density function changes as the shape parameter α and scale parameter β are adjusted via sliders. ② The core mathematical concept is the gamma distribution, a continuous probability distribution widely used in modeling waiting times, insurance claims, and other right-skewed data; its density function depends on α and β, and reduces to the exponential distribution when α=1. ③ Construction highlights: The GeoGebra commands include If to define the density function f conditionally, along with two sliders for alpha and beta, enabling real-time visualization of the curve's peak, skewness, and tail behavior as parameters vary. ④ This resource is suitable for high school to undergraduate statistics courses, as well as introductory data analysis, helping learners grasp how parameters shape the distribution and its connections to exponential and chi-squared distributions.
GeoGebra Commands & Parameters
If(x < 0, 0, x^(alpha - 1) * ℯ^(-x * beta) * beta^(alpha) / gamma(alpha)) → f
AI Drawing Prompt Reference
Draw a gamma distribution probability density function graph and observe how it changes by adjusting the shape parameter α and scale parameter β. First, create two sliders for α and β, then define the function f using the formula x^(α-1) * e^(-x * β) * β^α / Γ(α), with x ranging from 0 to positive infinity.
The prompt above was compiled from the original drawing commands and is for reference only.