
Function Zeros and Derivative Analysis
Loading the math board and drawing, please wait…
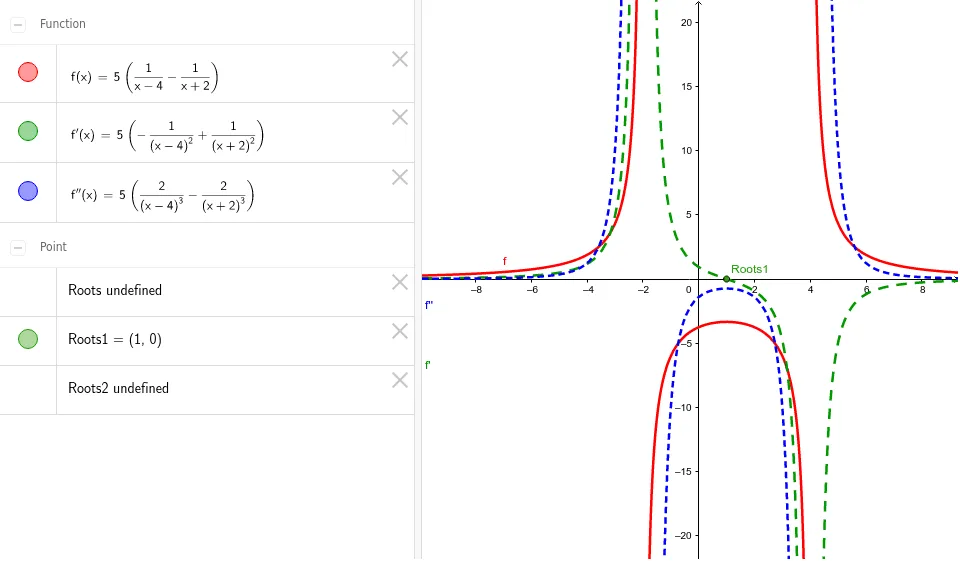
This example demonstrates how to plot a function and its derivative using GeoGebra, highlighting zeros. Core math concepts include functions, derivatives, zeros, and curve sketching. Construction involves commands like Roots, f, f', f'' to plot the function, its derivative, and identify zeros. Suitable for high school and above students studying calculus and function analysis.
GeoGebra Commands & Parameters
Roots(f, -10, 10) → RootsRoots(f', -10, 10) → Roots1Roots(f'', -10, 10) → Roots2
AI Drawing Prompt Reference
Plot a function along with its first and second derivatives, marking the zeros of the function, the first derivative, and the second derivative to highlight where the function crosses the x-axis, where the slope is zero, and where the concavity changes. Start by plotting the function, then plot its first and second derivatives, and finally mark the zeros of each curve.
The prompt above was compiled from the original drawing commands and is for reference only.