
Function Translation Demo by Walch Education
Loading the math board and drawing, please wait…
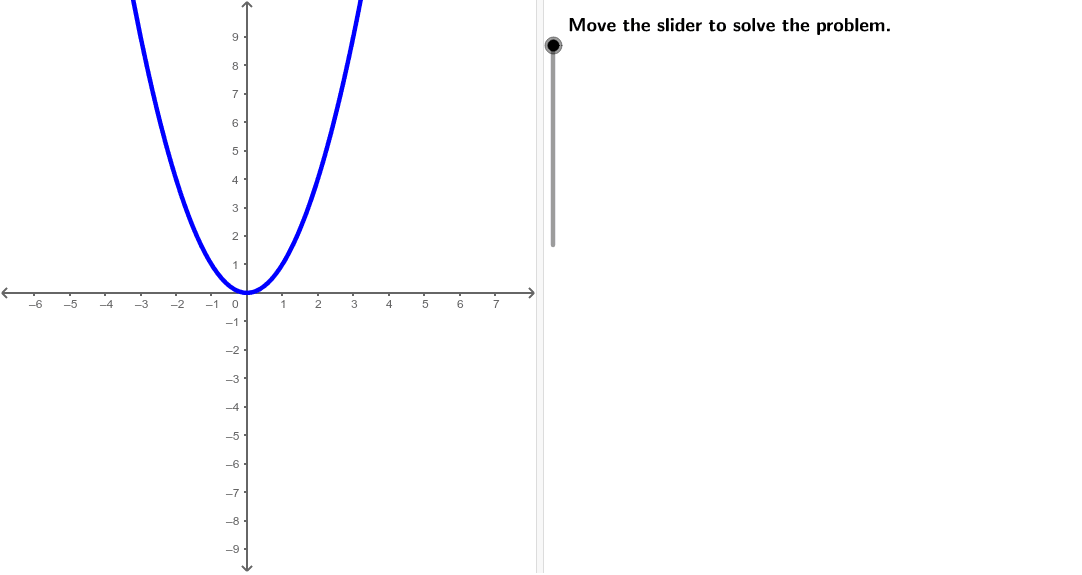
This example demonstrates the translation of the function f(x)=x² by a constant k=2, showing the graph of f(x)+k. It involves core math concepts like function graph translation and quadratic function properties. Constructed using GeoGebra commands such as Line, Point, Sequence, If, Textfield, and TableText to visualize the translation effect. Suitable for high school mathematics teaching to understand function graph transformation rules.
GeoGebra Commands & Parameters
Line((x(Corner[1]) + ((2 * indent) * screenwidth), 0), yAxis) → align1Line((x(Corner[1]) + ((3 * indent) * screenwidth), 0), yAxis) → align2Line((x(Corner[1]) + ((4 * indent) * screenwidth), 0), yAxis) → align3Point(xAxis) → APoint(xAxis) → BPoint(xAxis) → CPoint(xAxis) → DPoint(xAxis) → ESequence(f(Element[xValues, i]), i, 1, Length[xValues]) → fValuesSequence(f(Element[xValues, i]) + k, i, 1, Length[xValues]) → pValuesSequence((Element[xValues, i], Element[fValues, i]), i, 1, Length[xValues]) → fPointsSequence((Element[xValues, i], Element[pValues, i]), i, 1, Length[xValues]) → pPointsIf(k ≥ 0, "+", "") → showsignIf(k ≥ 0, "more", "less") → directionwordIf(k ≥ 0, "up", "down") → directionTextfield(f) → inputBox1TableText({{A1, B1, C1, D1, E1}, {A2, B2, C2, D2, E2}, {A3, B3, C3, D3, E3}}, "|_") → tabletext
AI Drawing Prompt Reference
Draw a demonstration of function graph translation, showing the graph of f(x)=x² translated upward by 2 units to f(x)+2. Include the x-axis and y-axis, and plot the graphs of both the original and translated functions. Mark five points on the x-axis corresponding to the function values of both functions, and connect these points with lines to form the function graphs. Label the original and translated functions, and indicate the direction and distance of the translation on the graph.
The prompt above was compiled from the original drawing commands and is for reference only.