
Function Transformation Demo
Loading the math board and drawing, please wait…
In collections
Graph Transformations
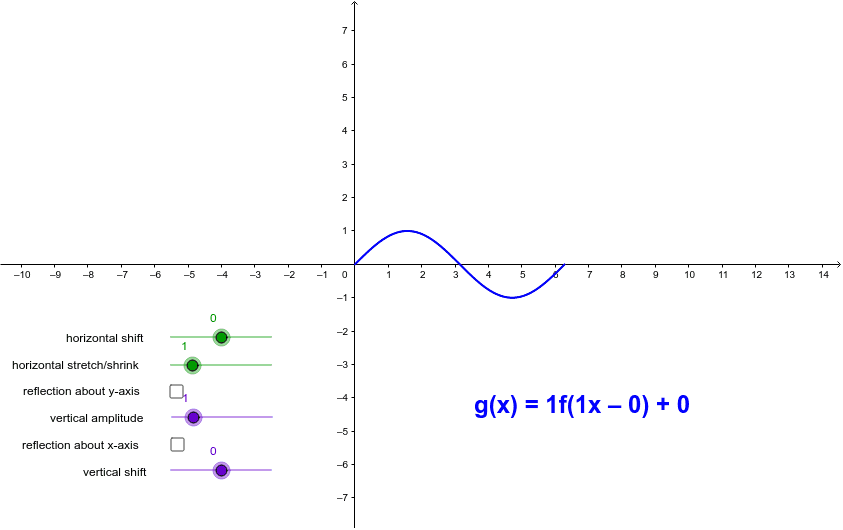
This worksheet demonstrates basic function transformations and combinations of transformations. It includes six possible transformations: horizontal shifts, vertical shifts, dilations, etc. Visualized through GeoGebra commands like Function, If, Slider, it shows how function graphs change with parameter variations. Suitable for high school mathematics teaching to help students understand the rules and applications of function transformations.
GeoGebra Commands & Parameters
Function(sin(x), 0, 6.28) → fIf(b ≟ true, -1, 1) → xrflIf(a ≟ true, -1, 1) → yrflFunction(xrfl * vamp * sin(yrfl * hamp * x - hs) + vs, Min[yrfl * 1 / hamp * (0 + hs), yrfl * 1 / hamp * (hs + 6.28)], Max[yrfl * 1 / hamp * (hs + 6.28), yrfl * 1 / hamp * (0 + hs)]) → h
AI Drawing Prompt Reference
Draw a sine function graph and demonstrate its transformations including horizontal and vertical shifts, dilations, etc. Start by plotting the basic sine curve, then reflect it along the x-axis and y-axis based on parameters. Multiply the reflected curve with the sine curve, apply shifts and dilations, and finally display the combined transformed function graphs to illustrate the rules and applications of function transformations.
The prompt above was compiled from the original drawing commands and is for reference only.