
Function Table View
Loading the math board and drawing, please wait…
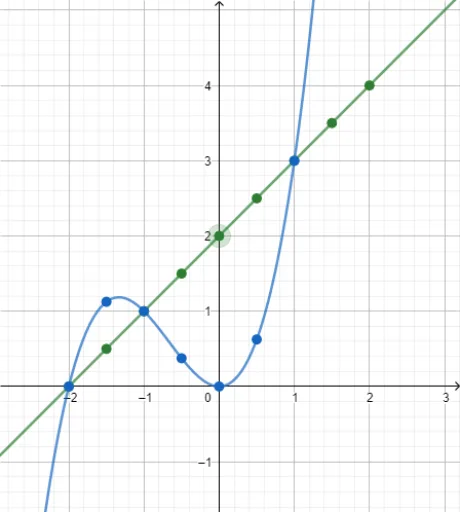
This example demonstrates how to create a table of values for a function, involving core math concepts like function graphs, Poisson distribution, rotation, and polygons. It uses GeoGebra commands f and g for construction, suitable for high school mathematics education and function graph learning.
GeoGebra Commands & Parameters
f(x) = x + 2g(x) = x^(3) + (2 * x^(2))
AI Drawing Prompt Reference
Create a function table with two functions: y = x + 2 and y = x³ + 2x². First, draw the graph of y = x + 2, then draw the graph of y = x³ + 2x² and show their value tables.
The prompt above was compiled from the original drawing commands and is for reference only.