
Function Intersection Demo
Loading the math board and drawing, please wait…
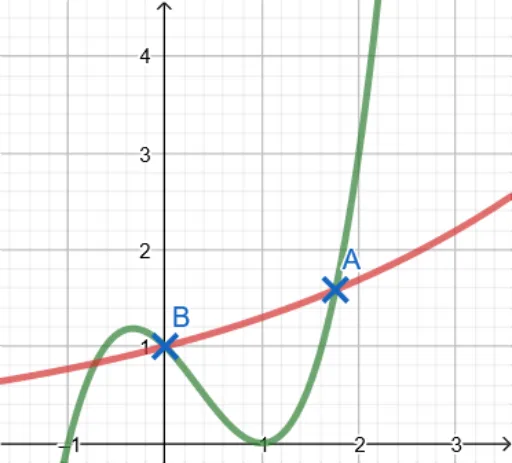
This example demonstrates the intersection points of two function graphs and their dynamic changes. It involves core mathematical concepts like functions, intersections, inequalities, definite integrals, similarity transformations, parametric curves, and statistics. The construction uses the GeoGebra command Intersect on functions f and g, and their intersection points A and B. Suitable for high school students and teachers for function graph analysis and comprehensive application teaching.
GeoGebra Commands & Parameters
Intersect(g, f, (1.7583193323785526, 1.5861665944585208)) → AIntersect(f, g, (0, 1)) → B
AI Drawing Prompt Reference
Draw the graphs of two functions and mark their intersection points, located at (1.7583193323785526, 1.5861665944585208) and (0, 1), to dynamically demonstrate the changes in the intersection points of the function graphs, suitable for high school function graph analysis and teaching.
The prompt above was compiled from the original drawing commands and is for reference only.