
Function Graphs & Inequalities Demo
Loading the math board and drawing, please wait…
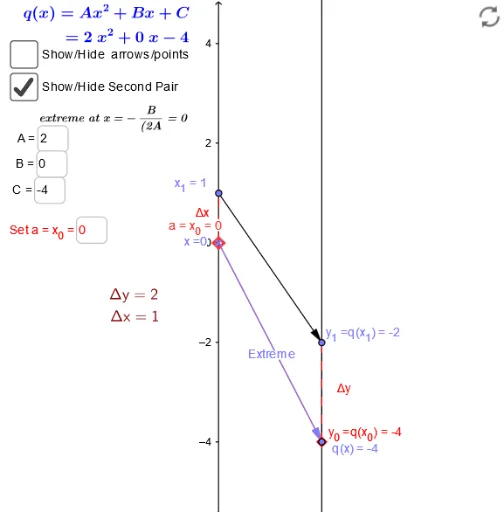
This example demonstrates the visualization of function graphs and inequalities, allowing dynamic parameter adjustments to observe changes. Core math concepts include functions, inequalities, triangles, logarithms, hypothesis testing, and set theory. Construction highlights use of GeoGebra commands like Vector, Textfield, Segment, and Sequence. Suitable for high school mathematics students and educators for teaching demonstrations and concept understanding.
GeoGebra Commands & Parameters
Vector(A_1, B_1) → uTextfield(f) → inputBox1Vector(x_1, y_1) → vSegment(q_x, F) → cSegment(E, F) → dSegment(A_1, x_1) → eSegment(B_1, y_1) → gSegment(B_1, y_1) → h_1Sequence(Vector[(0, i), (2, f(i))], i, -3, 3, 1) → list1Sequence((i, f(i)), i, -3, 3, 1) → list2Vector(G, H) → ExtremeTextfield(C) → InputBox1Textfield(A) → InputBox2Textfield(B) → InputBox3Textfield(xx_0) → InputBox4