
Function Graphs and Parametric Surfaces
Loading the math board and drawing, please wait…
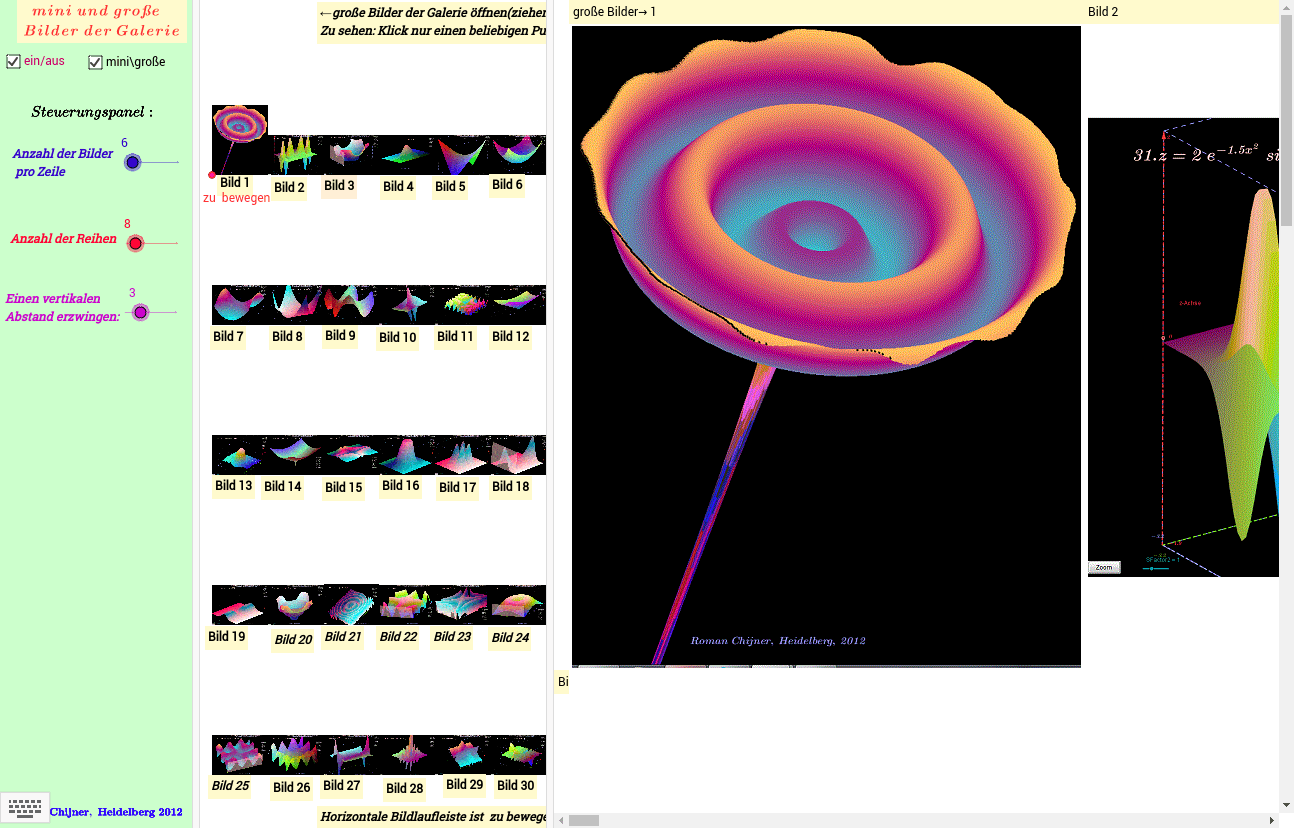
This example demonstrates the 3D graph of a function z = f(x,y) and its parametric surface. Key math concepts include functions, parametric equations, solid geometry, and coordinate geometry. Construction highlights the use of GeoGebra commands like Corner, Segment, Point, If, Sequence, and Join. Suitable for high school and above students to understand function visualization in 3D space and parametric surface creation.
GeoGebra Commands & Parameters
Corner(2) → W02Corner(4) → W04Corner(1) → W01Segment(W01, W02) → dPoint(d) → EIf(e, Nx, 1) → Nx1If(e, y(B), y(W01) + (Bild - 1) * sy) → y0If(e, x(B), x(E)) → x0If(e, c, sy) → yWIf(e, Ny, 40) → Ny1Sequence(y(C0 - yW * (j - 1)), j, 1, Ny1) → mySequence(x(C0 + xW * i), i, 0, Nx1) → mxJoin(Sequence[Sequence[{(Element[mx, i], Element[my, j]), (Element[mx, i + 1], Element[my, j])}, i, 1, Nx1], j, 1, Ny1]) → l1Sequence(Text[i], i, 1, (Nx1 + 1) * Ny1) → l2Corner(3) → W03
AI Drawing Prompt Reference
Visualize a 3D graph of a function z = f(x,y) and its parametric surface, highlighting key mathematical concepts like functions, parametric equations, solid geometry, and coordinate geometry. Start by creating a rectangular frame, then generate a grid of points on it to form the surface. Use conditional statements to control the placement of these points, ensuring the grid covers the entire area. Finally, connect all point pairs to form a continuous surface and label key positions.
The prompt above was compiled from the original drawing commands and is for reference only.