
Function Graphs and Limit Theorem Demo
Loading the math board and drawing, please wait…
In collections
Chapter 12: The Place of Parallels
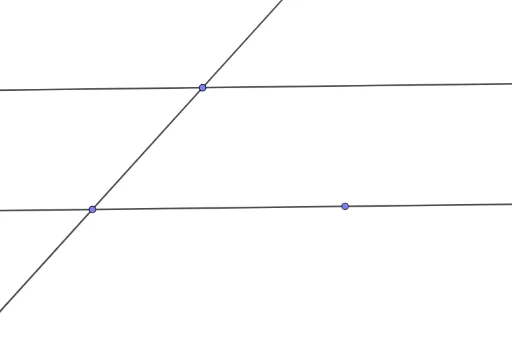
This example dynamically demonstrates function graphs, limit concepts, and median lines in linear programming, visually integrating geometry with algebra. Core math concepts include function graphing, limit calculation, linear optimization, median line geometry, and 3D shape construction. GeoGebra commands like Line, Point, and Angle are used to construct points, lines, angles, and functional relationships. Suitable for high school and above mathematics education to visualize calculus, coordinate geometry, and optimization problems.
GeoGebra Commands & Parameters
Line(A, B) → fLine(C, f) → gPoint(g) → DPoint(g) → EPoint(f) → FLine(F, D) → hAngle(C, D, F) → αAngle(A, F, D) → βLine(F, E) → iAngle(E, F, B) → γAngle(F, E, C) → δAngle(D, F, E) → ε
AI Drawing Prompt Reference
Draw a function graph and demonstrate its limit concept and median lines in linear programming, including the intersection points and tangent lines of two function graphs, along with related angles and median lines, start by plotting the two function graphs, then find the intersection points and median lines, and finally label the angle relationships.
The prompt above was compiled from the original drawing commands and is for reference only.