
Function Graph Transformations Demo
Loading the math board and drawing, please wait…
In collections
Grade 12 PreCalculus BC
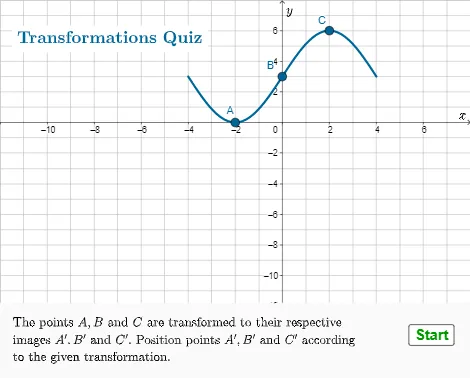
This example demonstrates the geometric process of transforming function graphs through point manipulation. It involves core math concepts like function graph translation, equilateral triangle construction, and coordinate geometry. Key GeoGebra commands and objects used include If, Random, RandomElement, Max, Min, Corner, and objects like f1, f3, f2, fn, f, A, yaa, xaa, qQ, c, cC, absc, xc, blist, b, bB, xa, B, C, alist, a, aA, d, dD, g, xbim, xaim, AANS, BANS, xcim, CANS, ymax, ymin1, B', C', vscale, ymin2, e, atext, ctext. Suitable for high school mathematics teaching to understand function graph transformation rules and programming applications.
GeoGebra Commands & Parameters
If(fn ≟ 1, f1, If[fn ≟ 2, f2, f3]) → fIf(fn ≤ 2, (-2, f(-2)), (-4, f(-4))) → ARandom(-8, 8) → cIf(qQ ≟ 2 ∨ qQ ≟ 3 ∨ qQ ≟ 4, 0, c) → cCIf(fn ≟ 3, 4, 2) → xcRandomElement(blist) → bIf(qQ ≟ 1 ∨ qQ ≟ 2 ∨ qQ ≟ 5, 1, b) → bBIf(fn ≟ 3, -4, -2) → xaIf(fn ≤ 2, (2, f(2)), (4, f(4))) → CRandomElement(alist) → aIf(qQ ≟ 1 ∨ qQ ≟ 3, 1, a) → aARandom(-10, 10) → dIf(qQ ≟ 4, 0, d) → dDIf(bB > 0, xa / abs(bB) + cC, ((-xa)) / abs(bB) + cC) → xaimIf(bB > 0, xc / abs(bB) + cC, ((-xc)) / abs(bB) + cC) → xcimMax({8, y(AANS) + 2, y(BANS) + 2, y(CANS) + 2}) → ymaxMin({-5.8, y(AANS) - 1.8, y(BANS) - 1.8, y(CANS) - 1.8}) → ymin1If(aA ≟ 1, "", If[aA ≟ -1, "-", Text[aA]]) → atextIf(cC ≟ 0, "", If[cC < 0, ("+" * Text[absc]), ("-" * Text[absc])]) → ctextIf(bB ≟ 1, "", If[bB ≟ -1, "-", Text[bB]]) → btextIf(dD ≟ 0, "", If[dD > 0, ("+" * Text[dD]), Text[dD]]) → dtextIf(qQ ≟ 1, q1text1, If[qQ ≟ 2, q2text2, If[qQ ≟ 3, q3text3, If[qQ ≟ 4, q4text4, If[qQ ≟ 5, q5text5, q6text6]]]]) → qftextCorner(5) → dimsMax({4 / abs(bB) + cC + 2, 8}) → xmaxMin({-4 / abs(bB) + cC - 2, -8}) → xmin
AI Drawing Prompt Reference
Draw a function graph transformation demonstration with three basic functions f1, f2, and f3. Show function graph translations and scalings through point coordinates A, C, and B. First, randomly select a function, then demonstrate function graph translations through point A and C coordinates, and show function graph scalings through point B coordinates. Finally, adjust the y-axis limits to ensure the graph is clearly visible.
The prompt above was compiled from the original drawing commands and is for reference only.