
Function Graph Plotting
Loading the math board and drawing, please wait…
In collections
Graphs and Mapping Diagrams
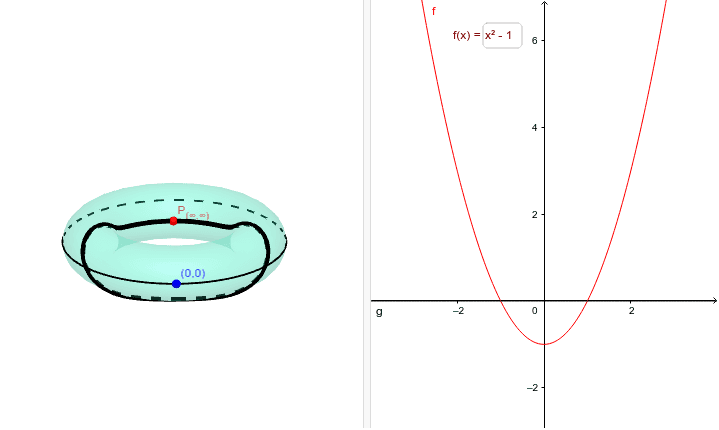
This example demonstrates how to plot a function graph in GeoGebra, representing a function RP^1 -> RP^1 as a subset of S^1 x S^1 (circle). Key math concepts include functions, Cartesian products, parametric equations, and analytical geometry. Construction highlights the use of commands like Surface, CurveCartesian, and Textfield with objects such as function f, circle R, parameter r, point a, graph_f, auxiliary point g, X-axis, origin O_{0,0}, point at infinity P_{(∞,∞)}, and inputBox1. Suitable for high school and above students to learn function graph plotting techniques, ideal for mathematical instruction and geometric visualization understanding.
GeoGebra Commands & Parameters
Surface(((R + (r * cos(u))) * cos(v)), ((R + (r * cos(u))) * sin(v)), (r * sin(u)), u, 0, 6.283185307179586, v, 0, 6.283185307179586) → aCurveCartesian(((3 + cos((2 * atan(f((2 * tan(v / 2))))))) * cos(v)), ((3 + cos((2 * atan(f((2 * tan(v / 2))))))) * sin(v)), sin((2 * atan(f((2 * tan(v / 2)))))), v, 0, 6.28319) → graph_fCurveCartesian(((3 + cos((2 * atan(g((2 * tan(v / 2))))))) * cos(v)), ((3 + cos((2 * atan(g((2 * tan(v / 2))))))) * sin(v)), sin((2 * atan(g((2 * tan(v / 2)))))), v, 0, 6.28319) → XaxisTextfield(f) → inputBox1
AI Drawing Prompt Reference
Plot a function graph showing how a function maps to points on a circle, featuring a parametric surface and a function curve rotating around the circle, with the X-axis and origin marked, and the function name labeled.
The prompt above was compiled from the original drawing commands and is for reference only.