
Function Graph and Geometric Construction
Loading the math board and drawing, please wait…
In collections
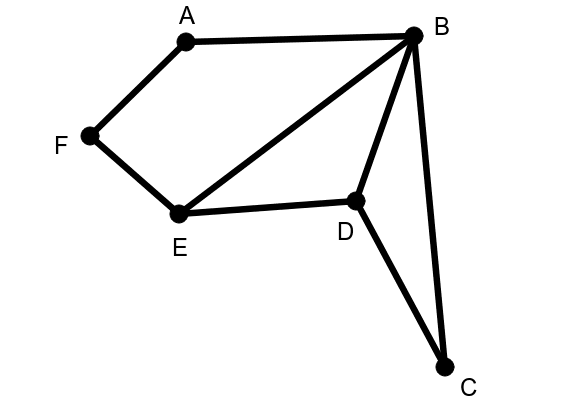
Searching for Eulerian and Hamiltonian Paths
This example demonstrates the plotting of function graphs and their integration with geometric constructions. It involves core math concepts like functions, area calculation, fractions, geometric mean, and statistics. GeoGebra commands such as segment creation, point placement, and color settings are used in the construction. Suitable for high school mathematics education, showcasing the integration of function graphs with geometric problems.
GeoGebra Commands & Parameters
Segment(A, F) → bSegment(F, E) → aSegment(A, B) → cSegment(B, E) → dSegment(E, D) → eSegment(B, D) → fSegment(C, B) → gSegment(D, C) → h
AI Drawing Prompt Reference
Draw a function graph and demonstrate its integration with geometric constructions. Start by creating several line segments connecting different points to form a geometric shape. These segments should intersect and connect with each other, creating a complex geometric structure. Include the function graph within the image, using distinct colors for different segments to highlight the relationship between the geometric construction and the function graph.
The prompt above was compiled from the original drawing commands and is for reference only.