
Function Domain Example
Loading the math board and drawing, please wait…
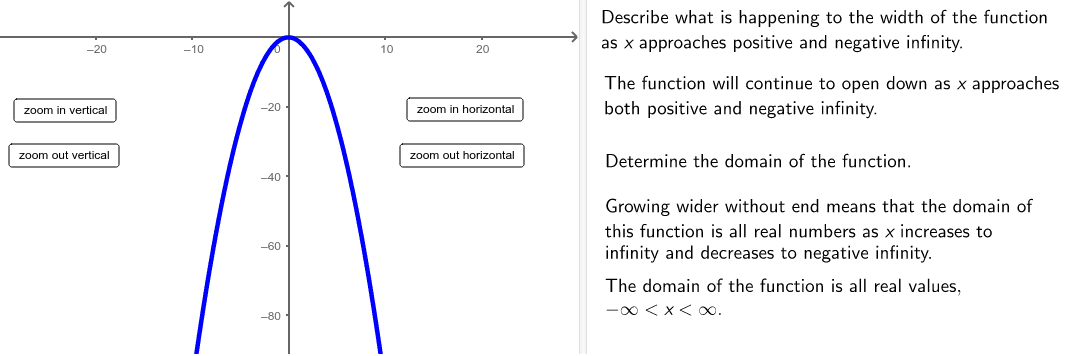
This example demonstrates how to describe the domain of a given function. Core mathematical concepts include functions, roots, and integrals. It is constructed using GeoGebra commands such as Polygon, Line, and Point. Suitable for high school students and teachers.
GeoGebra Commands & Parameters
Polygon((instructionEdge, y(Corner[1])), (instructionEdge, y(Corner[3])), Corner[4], Corner[1]) → mask, e, g, h, iLine((x(Corner[1]) + ((2 * indent) * screenwidth), 0), yAxis) → align1Line((x(Corner[1]) + ((3 * indent) * screenwidth), 0), yAxis) → align2Line((x(Corner[1]) + ((4 * indent) * screenwidth), 0), yAxis) → align3Point(e) → APoint(e) → BLine(A, B) → bPolygon((edge, y(Corner[1])), Corner[2], Corner[3], (edge, y(Corner[4]))) → poly1, c, d, j, kPolygon(C, D, E, F) → poly2, c_1, d_1, e_1, f_1
AI Drawing Prompt Reference
Draw the graph of a function to illustrate its domain. First, create a polygon connecting the vertical intersections of the function at two endpoints with the x-axis, then connect these intersections with a horizontal line. Next, draw two polygons below the horizontal line to represent the integral regions of the function, ensuring they align with the x-axis intersections and endpoints. The construction order should be: vertical intersections first, then the horizontal line, followed by the two lower polygons.
The prompt above was compiled from the original drawing commands and is for reference only.