
Function Domain and Range Animation
Loading the math board and drawing, please wait…
In collections
Chapter 3__Graphing Linear Functions
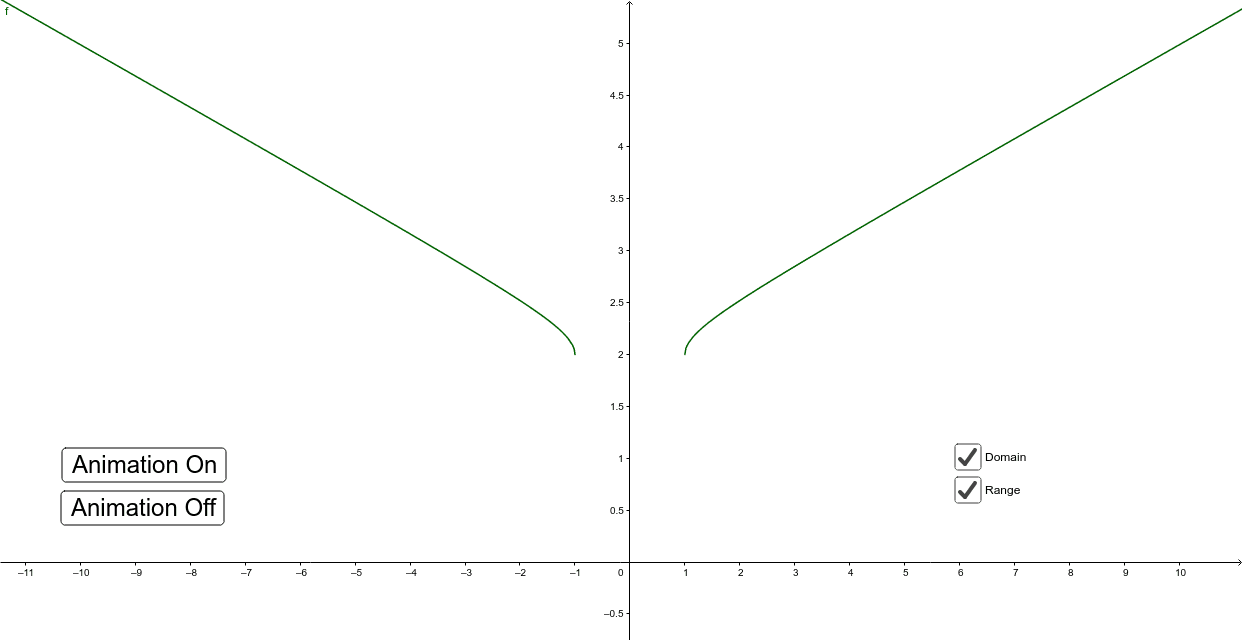
This example demonstrates the animation of a function's domain and range. Key mathematical concepts include functions, domain, and range. Using GeoGebra commands such as OrthogonalLine, Intersect, and Vector, the function's graph changes dynamically. Suitable for high school mathematics education, particularly for learning function graphs and properties.
GeoGebra Commands & Parameters
OrthogonalLine(A, xAxis) → bIntersect(b, xAxis) → BVector(A, B) → uOrthogonalLine(A, yAxis) → cIntersect(c, yAxis) → CVector(A, C) → v
AI Drawing Prompt Reference
Create an animated graph of a function showing its domain and range. Place a moving point on the curve. From this point, draw perpendicular lines to the x-axis and y-axis, marking the intersection points on each axis. Then draw arrowed vectors from the moving point to these two intersection points, representing the x-coordinate and y-coordinate. As the point moves along the curve, the perpendiculars, intersections, and vectors update dynamically, illustrating the input and output intervals. Include coordinate axes, the function curve, the moving point, perpendicular lines, foot points, and vector arrows. Keep the visualization clean and suitable for classroom demonstration.
The prompt above was compiled from the original drawing commands and is for reference only.