
Fruit Fly Population Table and Line Graph Visualization
Loading the math board and drawing, please wait…
In collections
CCGPS CA Unit 4 Lesson 2
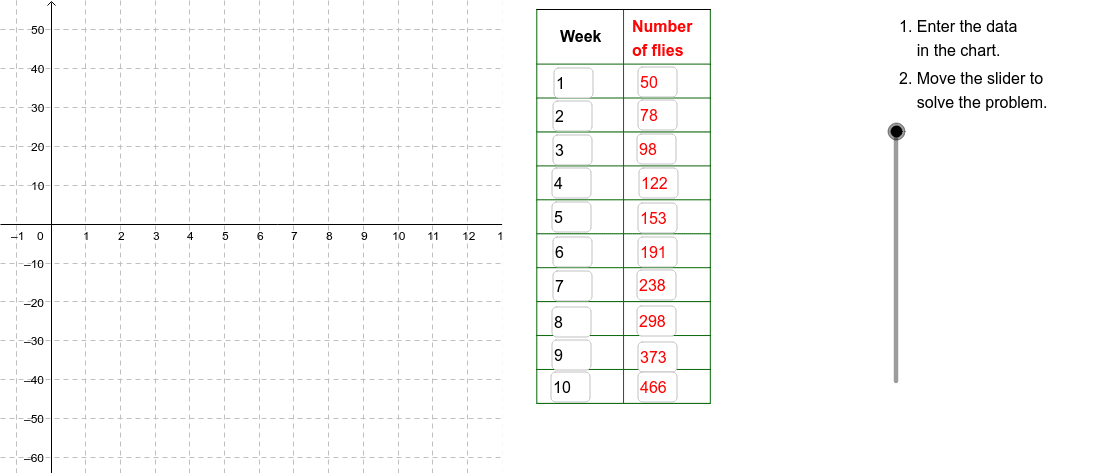
This GeoGebra example demonstrates how to model and visualize the population growth of fruit flies over a 10-week period using a data table and a connected line graph. The core mathematical concepts involved include exponential or linear growth models, discrete data sequences, coordinate geometry, and data interpolation. To construct the visualization, the example utilizes the `Textfield` command to display text, `Sequence` to generate coordinate points or data values from A1 to D11, and `Segment` along with `Polygon` commands to connect these sequential points, illustrating the population trend over time. This resource is highly suitable for high school algebra, statistics, or data science classrooms, helping students grasp the practical application of functions in biological modeling.
GeoGebra Commands & Parameters
Textfield(A2) → InA2Textfield(A3) → InA3Textfield(A4) → InA4Textfield(A5) → InA5Textfield(A6) → InA6Textfield(A7) → InA7Textfield(A8) → InA8Textfield(A9) → InA9Textfield(A10) → InA10Textfield(A11) → InA11Textfield(B2) → InB2Textfield(B3) → InB3Textfield(B4) → InB4Textfield(B5) → InB5Textfield(B6) → InB6Textfield(B7) → InB7Textfield(B8) → InB8Textfield(B9) → InB9Textfield(B10) → InB10Textfield(B11) → InB11Polygon((13, y(Corner[1])), Corner[2], Corner[3], (13, y(Corner[4]))) → poly1, b, c, d, eSequence(Segment[(14, (-46) + (8.7 * i)), (19, (-46) + (8.7 * i))], i, 0, 10) → CrossList1Segment((14, 55), (19, 55)) → Top1Segment((19, 55), (21.5, 55)) → Top2Segment((21.5, 55), (24, 55)) → Top3Segment((21.5, -46.256410256410255), (21.5, 54.743589743589745)) → Side2Segment((24, -46), (24, 55)) → Side3Sequence(Segment[(21.5, (-46) + (8.7 * i)), (24, (-46) + (8.7 * i))], i, 0, 10) → CrossList3Sequence(Segment[(19, (-46) + (8.7 * i)), (21.5, (-46) + (8.7 * i))], i, 0, 10) → CrossList2Sequence(Segment[(14 + (2.5 * i), (-46)), (14 + (2.5 * i), 55)], i, 0, 2) → SideList1
AI Drawing Prompt Reference
Create a graph showing the growth of fruit fly population over 10 weeks. Start by entering the population numbers from A2 to A11 and the corresponding weeks from B2 to B11. Then, use the polygon command to draw a rectangular frame to represent the data range. Next, draw a series of horizontal segments to represent the population at each time point. Finally, use a series of vertical and horizontal segments to create a grid for better data visualization.
The prompt above was compiled from the original drawing commands and is for reference only.