
Frequency Polygon Example
Loading the math board and drawing, please wait…
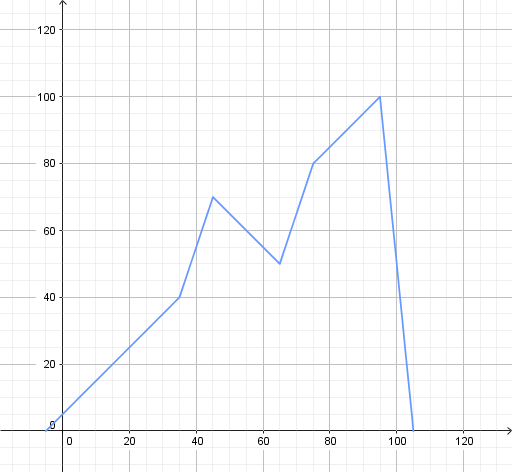
This example demonstrates how to construct a frequency polygon for a single data set using GeoGebra. Key math concepts include frequency distribution, statistical graphs, and polygon construction. The construction uses commands like FrequencyPolygon, ClassBoundaries for class intervals, ClassHeights for frequencies, and object B as an auxiliary element. Suitable for high school statistics education or for those interested in data visualization techniques.
GeoGebra Commands & Parameters
FrequencyPolygon(ClassBoundries, ClassHeights) → B
AI Drawing Prompt Reference
Create a frequency polygon graph for a single dataset. Start by defining class boundaries and calculating class frequencies. Plot points at the midpoints of each class interval, with x-coordinates as class boundaries and y-coordinates as frequencies. Connect these points sequentially with straight line segments to form a polygonal line. Include labeled axes and gridlines for clarity, ensuring the polygon visually represents the frequency distribution.
The prompt above was compiled from the original drawing commands and is for reference only.